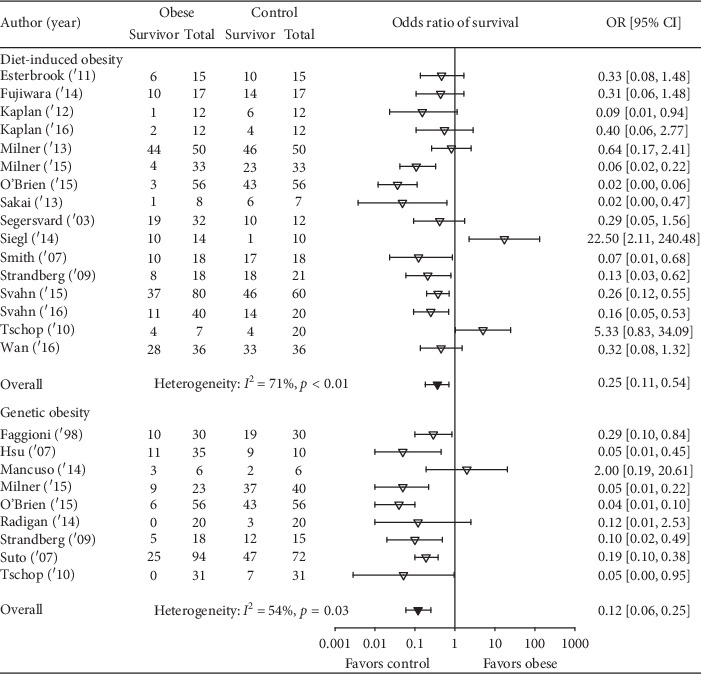
Figure 3.

The number of total and surviving animals in obese and control groups for studies employing either a diet-induced obesity model or genetic-induced obesity model and the effects of obesity on the odds ratios (OR (95% CI)) of survival for each study and the overall OR (95% CI) for each type of obesity model and the associated I2 and its level of significance. As described in the results, because four studies examined both diet and genetic obesity models, this figure presents 25 comparisons, 16 with diet and 9 with genetic obesity models. The effects of obesity did not differ statistically significantly comparing the two types of models (p=0.19).
