
Figure 6.
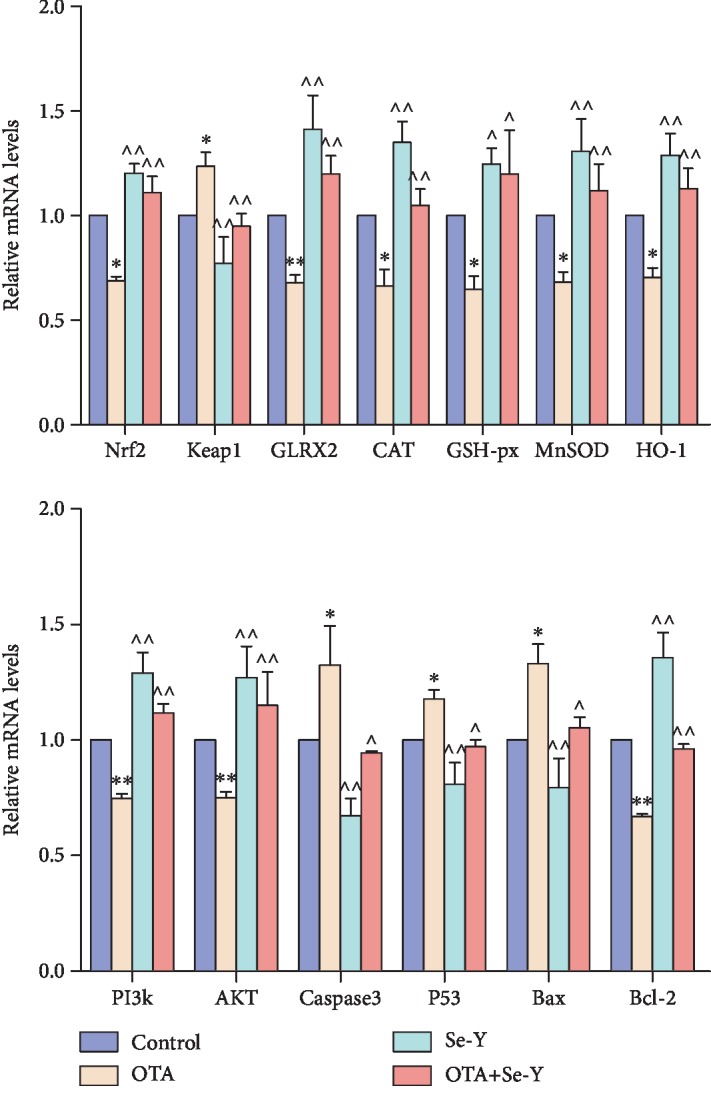
Effects of selenium yeast on the expression levels of genes involved in the Nrf2/Keap1 and PI3K/AKT signaling pathways that were induced by OTA in the chicken kidneys. n = 6 chickens/group. ∗p < 0.05, ∗∗p < 0.01 vs. control group. ^p < 0.05, ^^p < 0.01 vs. OTA group.