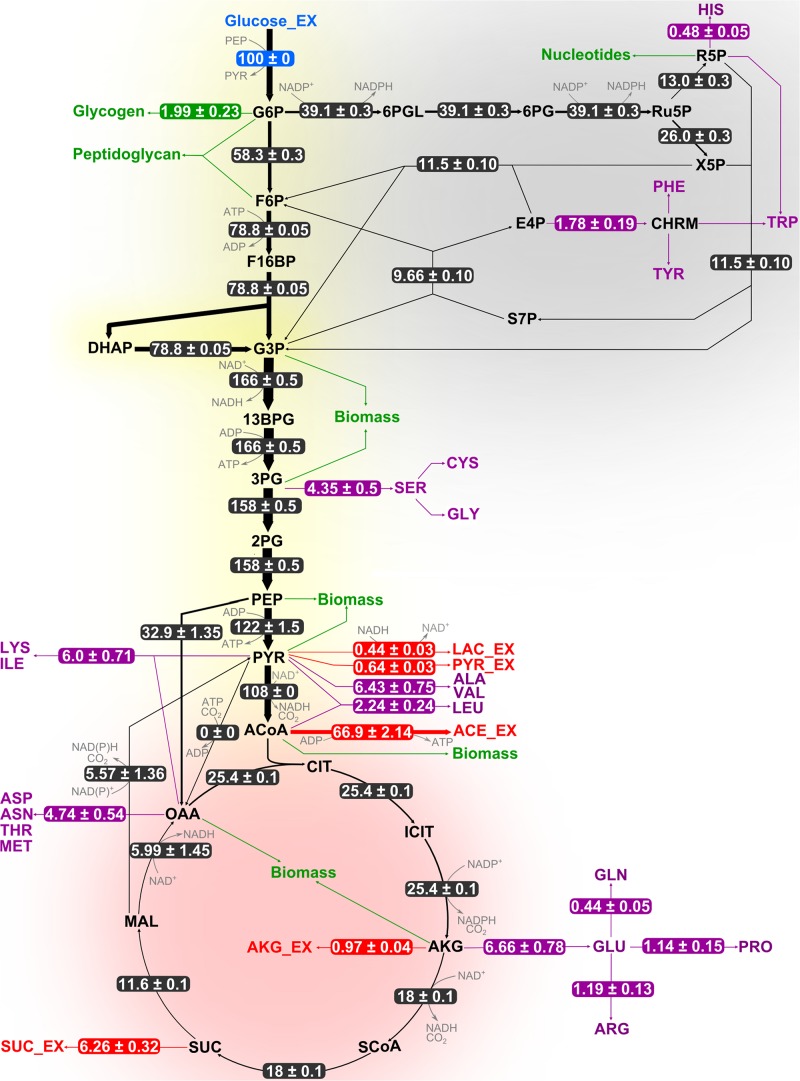
FIGURE 4.
Flux distribution within the central carbon metabolism of B. megaterium DSM319 growing at 37°C in M9 minimal medium. Fluxes were determined combining labeling data sets from experiments with 100% 1-13C glucose and with a mixture of 50% U-12C/50% U-13C glucose, respectively. They are given as relative values (%) after normalization with the glucose uptake rate. Fluxes to amino acids (purple) and secretion of organic acids (red) are issued from measurements and were not simulated. Green arrows represent precursor withdrawal for the synthesis of biomass compounds.

