. 2020 Feb 14;9:e53008. doi: 10.7554/eLife.53008

Figure 4. Distribution of the immune cells’ subgroups and significant differences in the morphological and functional TILs categories.

The percentage of cells for each inflammatory subpopulation across all the cores is showed in (A). The 17 phenotypic clusters are on the upper side of the graph, while at the bottom each of them is subdivided in the respective functional subclusters. BC = B cells; cDC1 = classical dendritic cells type 1; cDC2 = classical dendritic cells type 2; Epith = epithelial cells; PC = plasma cells; Lang = Langerhans cells; LV = lymph vessels; Macroph = macrophages; pDC = plasmocytoid dendritic cells; S-M+=S100+MelanA- melanoma cells; S+M-=S100-MelanA+=melanoma cells; S+M+=S100+MelanA+ melanoma cells; Tcy = cytotoxic T cells; Tfh = T follicular helpers; Th = T helpers; Treg = regulatory T cells; suffix: ‘prolif’=proliferating, IFNg = interferon gamma. (B) Significant differences (p.value <0.05) in cell percentages between brisk and non-brisk categories (Wilcoxon rank sum test). (C) Significant differences (p.value <0.05) in cell percentages across the functional groups: Active, Transition, Exhausted (Kruskal-Wallis rank sum test).

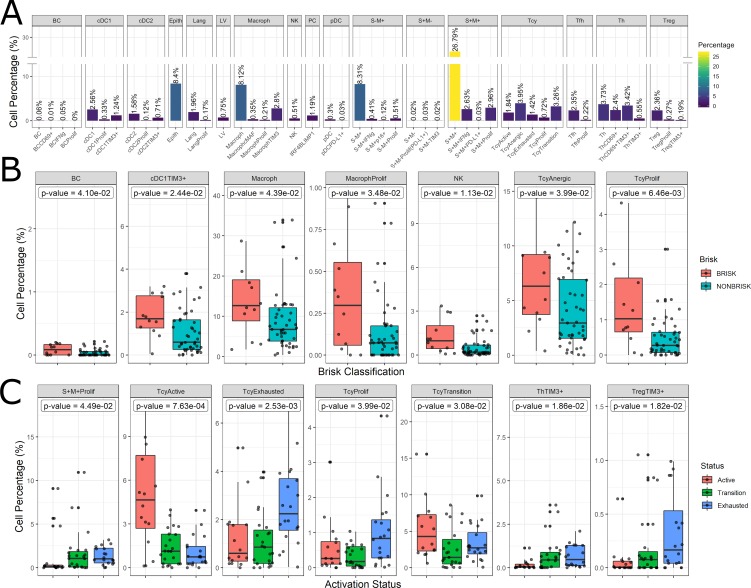
Figure 4.

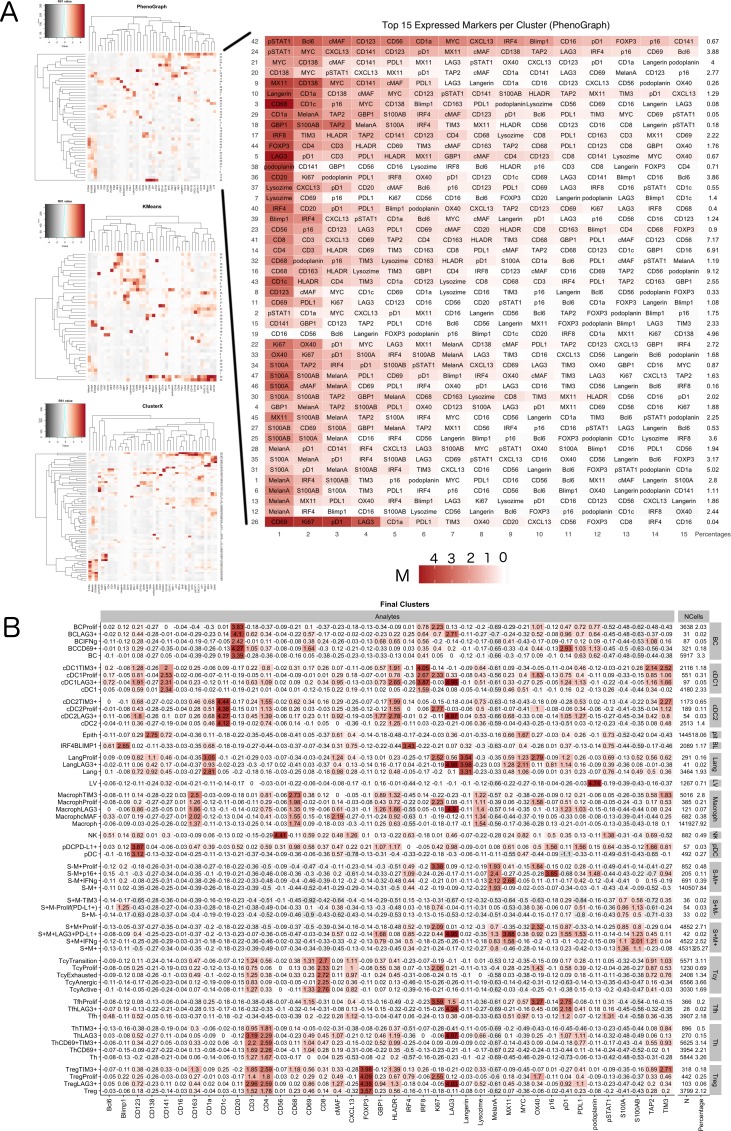
Figure 4—figure supplement 1. Phenotype Identification.

Figure 4—figure supplement 1.

A two-tier approach was implemented for the identification of cell subpopulations. (A) Initially, heatmaps generated with KMeans, PhenoGraph, and ClusterX (left) were used to identify the main inflammatory subpopulations, resulting in clusters that were named by manual annotation by the pathologist based on the level of expression of the phenotypic markers; on the right one of the heatmaps is enlarged to serve as an example: for each cluster identified by phenograph the levels of expression of the 15 most expressed markers have been used by the pathologist to identify the inflammatory population most probably present in that cluster. The final phenotypes were defined using a consensus-based approach (a phenotype was assigned if two or more clustering methods agreed in their prediction). (B) Cell populations were further sub-clustered into functional subgroups using PhenoGraph over the set of functional markers and annotation by the pathologist. For each cluster identified with the Materials and method described, here the identified subclusters are shown as an heatmap with the corresponding levels of expression of the selected functional markers.