Figure 1.
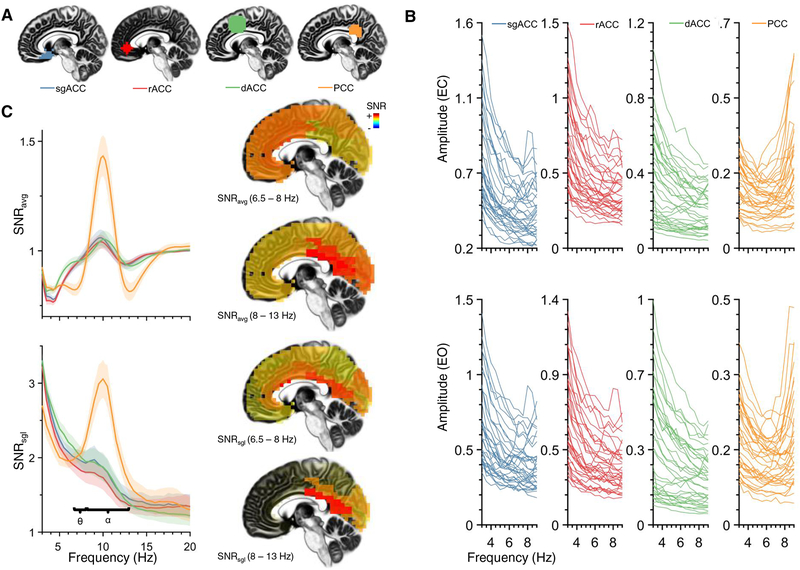
Individual amplitude spectra and signal-to-noise ratio (SNR) for different regions-of-interest (ROIs) within the cingulate cortex (ACC/PCC: anterior/posterior cingulate cortex; sg: subgenual; r: rostral; d: dorsal). (A) Four different ACC ROIs. From left to right: subgenual ACC (sgACC), rostral ACC (rACC), dorsal ACC (dACC), and posterior cingulate cortex (PCC). (B) Mean amplitude spectra for each participant (across 148 random epochs) from the first resting EEG session, displayed separately for eyes closed (EC, top panel) and eyes open (EO, bottom panel). Most individual spectral were not characterized by a distinct peak within the 4–8 Hz theta range (ROIs as in A). (C) SNR operationalized as the ratio of spectral amplitude at a single frequency bin to the average amplitude of the surrounding ±5 Hz (SNRavg, left column, top panel) and as the average cross-trial spectral amplitude in relation to the single-trial standard deviation of the amplitude spectrum (SNRsgl, right column, bottom panel; see text for computational details). Shaded regions indicate 1000-fold bootstrapped 95% confidence interval of the mean. In both cases, SNR was greatest for alpha-band activity at the PCC, more modest for the theta band, and theta SNR was largest for the dACC. Theta and alpha SNR is also displayed on sagittal view of eLORETA brain (right column; warmer colors depict higher SNR). Theta was characterized by higher SNR at dACC and PCC regions, than rACC or sgACC. Alpha was characterized by high SNR at posterior regions.

