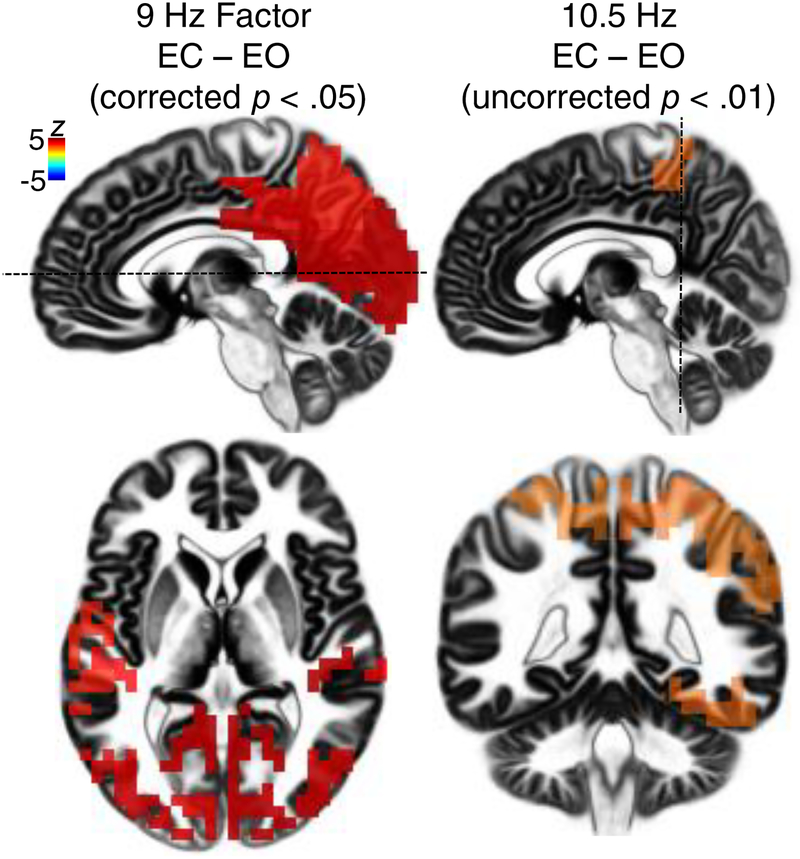
Figure 3.
Statistical evaluation of net alpha (EC-EO) tomographies stemming from the combined CSD/eLORETA fPCA solution shown in Fig. 2. Hot colors (reds and oranges) indicate greater alpha for EC than EO. Low alpha showed robust condition differences (thresholded at corrected p < .05); by comparison, condition differences for high alpha did not survive multiple comparisons correction and are presented with a more liberal threshold (uncorrected p < .01). Maximal condition differences for low alpha were near the lingual gyrus / V1, but there were also significant net low alpha effects distributed across the occipital cortex and temporal gyri. Condition differences for high alpha were maximal near the superior and inferior parietal lobe, and right fusiform gyrus. Hatched lines on sagittal planes (top panels) indicate view for axial (bottom left) and coronal (bottom right) views.

