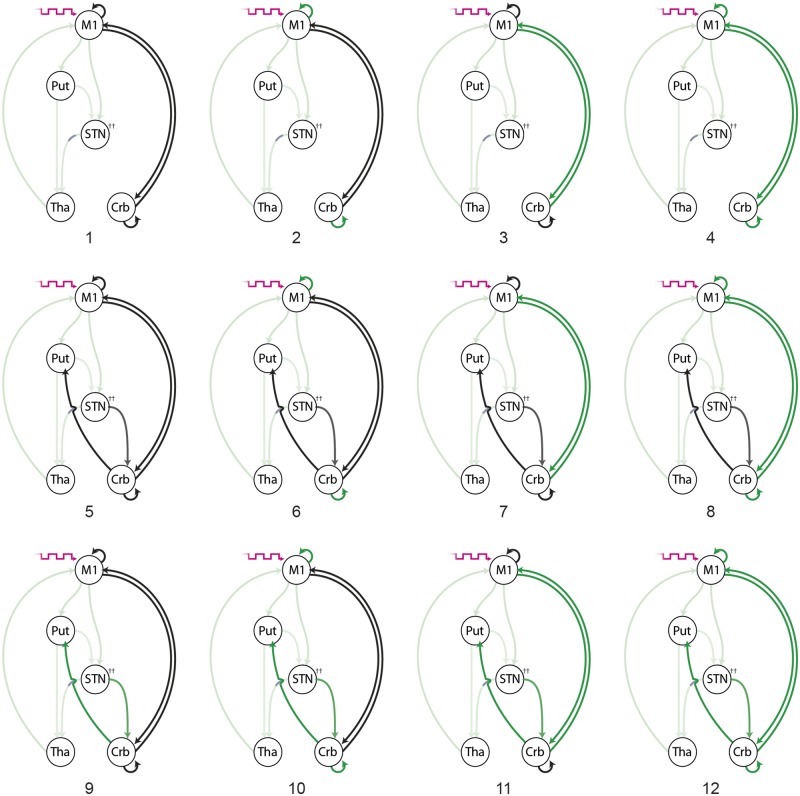
Figure 1.
Experiment II and III model space: 12 competing models of the functional architecture underlying both the voluntary movement and resting states. For the movement functional MRI data, the main effect of voluntary movement (magenta arrow) drives M1 (DCM C-matrix); this driving input was not present when models were fit to the resting data. Black arrows represent the recruitment of directed effective connectivity during the behavioural state (DCM A-matrix). Green arrows represent modulation of effective connectivity by active DBS during the behavioural state (DCM B-matrix). All models share modulatory effects on basal ganglia pathways, which are highlighted in a lighter green. All models assume that the STN–thalamus (Tha) pathways exerts inhibition on the thalamus. All other pathways are excitatory. Crb = cerebellum; Put = putamen.

