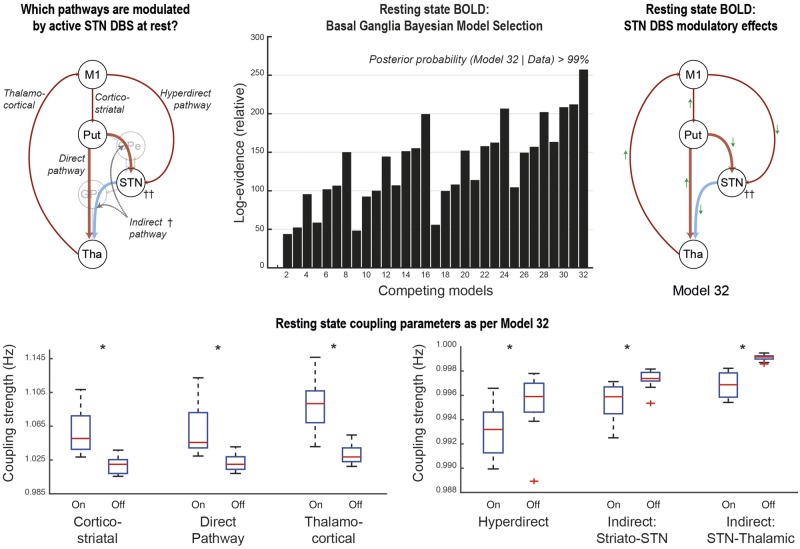
Figure 3.
Experiment I model comparisons and coupling parameters: BMS revealed that model 32 was the most likely generator of the data. The direction of modulatory effects on the various basal ganglia pathways are summarized by the green arrows. Red arrows represent excitatory effective connectivity, whereas blue arrows represent inhibitory effective connectivity. T-tests revealed significant differences in all coupling parameters associated with active DBS. Note the difference in scale for the indirect and hyperdirect pathways compared to the direct pathway. The central mark in each box is the median, the edges of the box are the 25th and 75th percentiles, respectively, the whiskers extend to the most extreme data points the algorithm considers to be not outliers. *P < 0.05 corrected for multiple comparisons using the Bonferroni procedure.

