Figure 4.
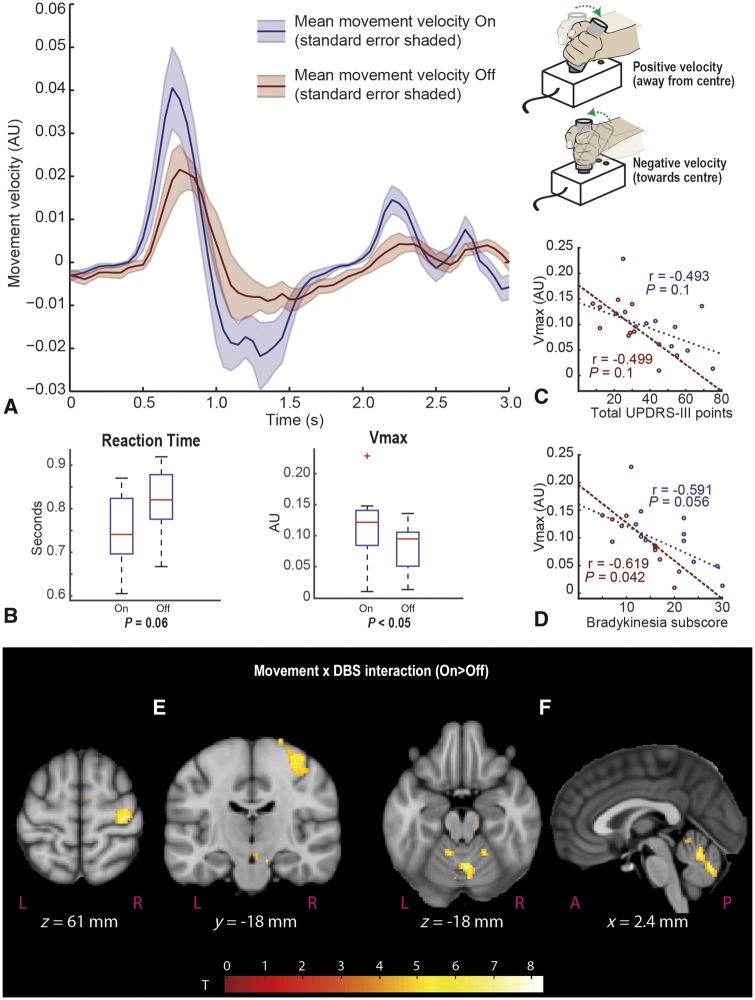
The effect of DBS on Vmax and reaction time and regional BOLD activity. (A) The mean velocity plot for a single movement trial – on and off compared. Cue sounds at time = 0 with joystick in central position. Positive velocity occurs when subject moves joystick away from the central position towards their chosen direction, slows to 0 at maximal displacement, then velocity is negative as the handle is returned to the centre position. (B) Mean reaction time and Vmax on and off stimulation. Note that reaction time differences are only trend significant. (C and D) Scatter plots of total UPDRS score, and bradykinesia sub-score against Vmax. Maroon plots represent off values, blue plots represent on values. Two clusters were identified as significant following whole brain correction in (E) M1 hand area contralateral to movements, and (F) midline cerebellum encompassing left crus V, vermis and right crus V and VI. Second level SPMs overlaid on the MNI brain. SPMs are thresholded at a voxel level of P < 0.001 (uncorrected), cluster extent threshold = 0. Additional activations at this threshold can be seen in the supplementary motor area and midbrain (E), although these did not survive cluster-wise corrected significance.

