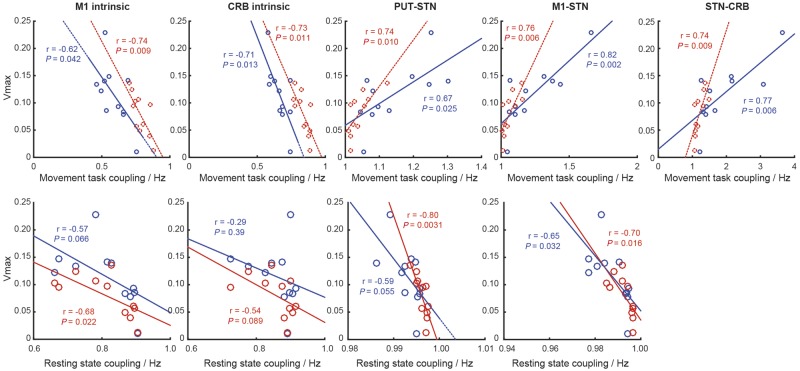
Figure 6.
Exploratory correlation analysis looking for relationships between coupling strength and measured peak movement velocity (Vmax). Blue data points and lines of best fit represent DBS on, red data points and lines of best fit represent DBS off. Pearson’s r and P-values are reported in line. CRB = cerebellum; Put = putamen.

