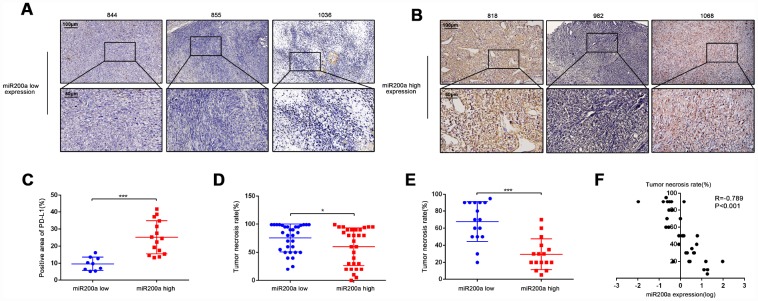
Figure 6.
High expression of miR-200a predicts the poor response to chemotherapy. (A–C) Immunohistochemical staining analysis of PD-L1 expression in samples of osteosarcoma patients. The quantification of immunohistochemical staining was based on its positive area. Scale bar represents 50μm and 100μm separately. (D) Comparison of TNR in biopsy tissue of 62 osteosarcoma patients acquired from the GEO database (GSE39058-GPL15762). Divided them into two groups according to miR-200a expression. (E) Comparison of TNR in resection tissues of 32 osteosarcoma patients. Divided them into two groups according to miR-200a expression. (F) Correlation analysis between miR-200a and TNR in resection tissues of 32 osteosarcoma patients. The expression of miR-200a was log-transformed. *P<0.05, **P<0.01, ***P<0.001.

