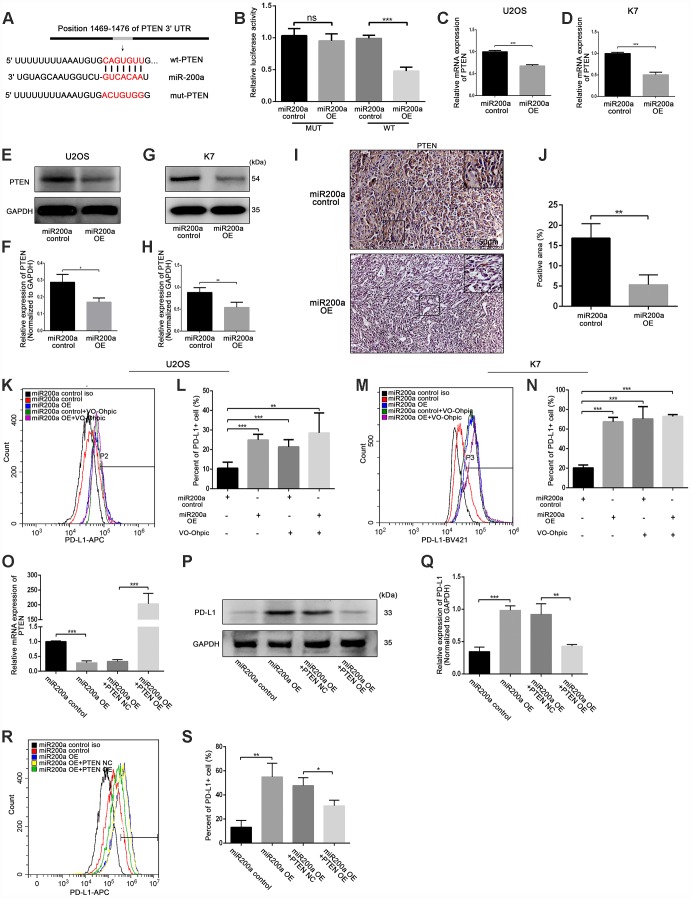
Figure 7.
miR-200a up-regulated PD-L1 expression by targeting PTEN. (A) miR-200a target sequence binding to PTEN 3-UTR was predicted with TargetScan. mut-PTEN, mutated from the seed matches, was indicated. (B) Transfected miR-200a overexpressing plasmid with wt-PTEN or mut- PTEN separately in U2OS, measured with luciferase assays. A Renilla luciferase plasmid was co-transfected as a transfection control. (C) qRT-PCR analysis of PTEN in U2OS miR-200a control and miR-200a OE. (D) qRT-PCR analysis of PTEN in K7 miR-200a control and miR-200a OE. (E and F) Western blot analysis of PD-L1 in U2OS miR-200a control and miR-200a OE. (G and H) Western blot analysis of PD-L1 in K7 miR-200a control and miR-200a OE. (I and J) Immunohistochemical staining analysis of PTEN expression in tumor tissues. Scale bar represents 50μm. (K and L) Flow cytometry analysis of PD-L1 expression of U2OS miR-200a control and miR-200a OE after the addition of VO-Ohpic. (M and N) Flow cytometry analysis of PD-L1 expression of K7 miR-200a control and miR-200a OE after the addition of VO-Ohpic. (O) qRT-PCR analysis of PTEN in U2OS miR-200a control and miR-200a OE after PTEN overexpressing. (P and Q) Western blot analysis of PD-L1 in U2OS miR-200a control and miR-200a OE after PTEN overexpressing. (R and S) Flow cytometry analysis of PD-L1 expression of U2OS miR-200a control and miR-200a OE after PTEN overexpressing. *P<0.05, **P<0.01, ***P<0.001.

