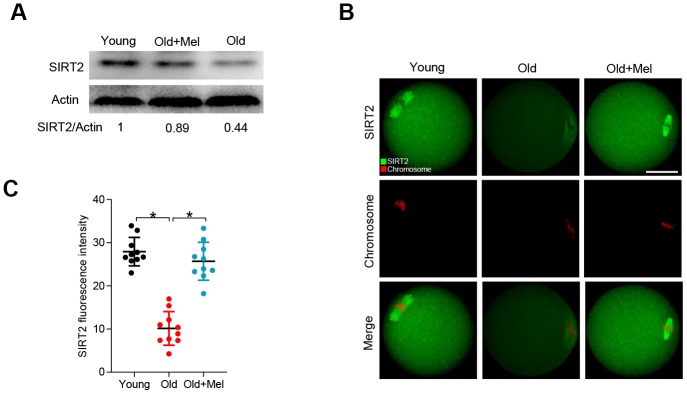
Figure 2.
Effects of melatonin administration on SIRT2 expression in oocytes from old mice. (A) Western blot analysis shows the SIRT2 expression in GV oocytes from young, old and old+Mel mice. Actin served as a loading control. Band intensity was calculated using ImageJ software. (B) Representative confocal images of young, old and old+Mel MII oocytes stained with SIRT2 antibody (green) and counterstained with propidium iodide (red) for chromosomes. (C) Quantification of the relative fluorescence intensity of SIRT2 in oocytes in (B). Each data point represents an oocyte (n=10 for each group). *P<0.05 vs. controls. Scale bar: 50 μm.

