Figure 6.
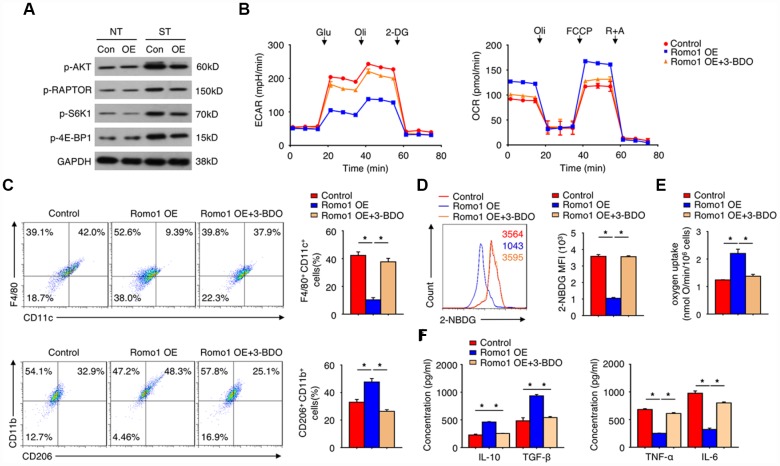
The overexpression of Romo1 promoted M2 polarization through mTORC1 signaling pathway in macrophages. (A) The expression of the indicated proteins was examined by western blotting in the control and Romo1-overexpressed macrophages with or without treatment of LPS (NT: without treatment; ST: LPS stimulation). (B) The ECAR and OCR of control and Romo1-overexpressed (with or without treatment of 60μM 3-BDO) macrophages were measured under basal conditions followed by the indicated treatment. (C) The control and Romo1-overexpressed (with or without treatment of 60μM 3-BDO) macrophages were respectively analyzed by flow cytometry with M1 or M2 markers. (D) The levels of 2-NBDG were analyzed by flow cytometry in control and Romo1-overexpressed (with or without treatment of 60μM 3-BDO) macrophages. (E) The oxygen uptake rates were measured and quantified in the control and Romo1-overexpressed (with or without treatment of 60μM 3-BDO) macrophages. (F) The production of IL-10, TGF-β, TNF-α or IL-6 was respectively analyzed by ELISA in control and Romo1-overexpressed (with or without treatment of 60μM 3-BDO) macrophages. Data are representative of at least three independent experiments and are presented as mean ± SD. ns, not significant; *, P < 0.05; **, P < 0.01.

