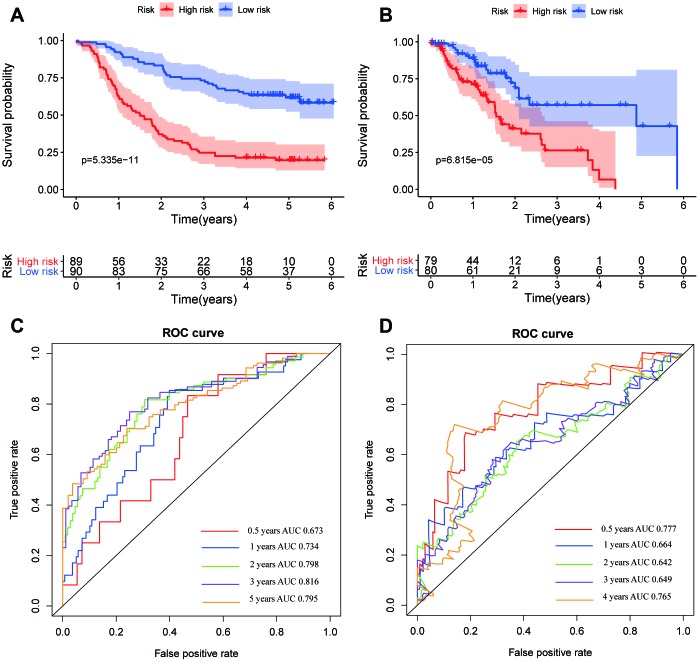
Figure 3.
Kaplan–Meier survival and ROC curves of the eight-lincRNA prognostic signature. (A, B) Kaplan-Meier survival curves of overall survival among risk stratification groups in the GEO (A) and TCGA (B) set. (C, D) ROC curves with calculated AUCs for risk prediction in 0.5-, 1-, 2-, 3-, 5-years in the GEO (C) and TCGA (D) sets.

