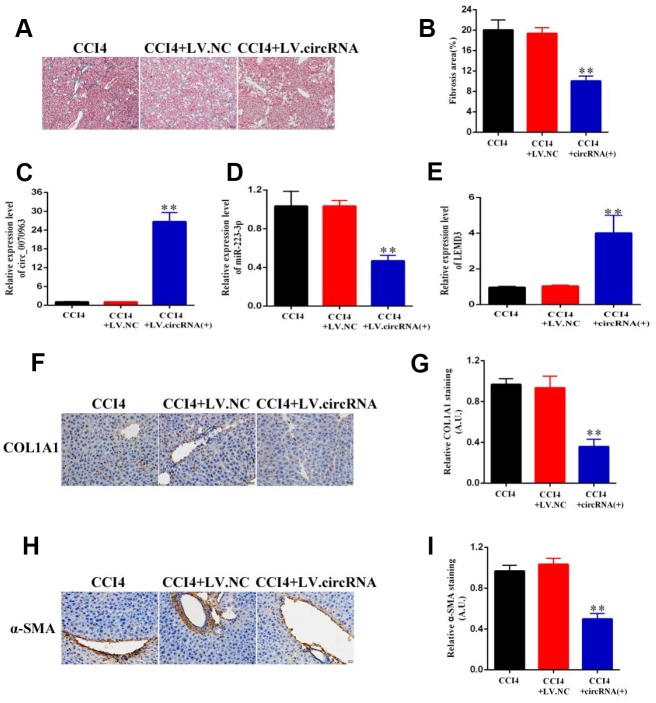
Figure 7.
Hsa_circ_0070963 upregulation suppresses CCl4-induced liver fibrosis in mice. (A, B) Accumulation of collagen was assessed by Masson staining and the fibrosis area was quantified. The scale bar represents 100 μm. (C, E) The mRNA expression levels of hsa_circ_0070963 (C), miR-223-3p (D), and LEMD3 (E) were analyzed by qRT-PCR in each group. (F–I) Col1A1 and α-SMA levels were examined by immunohistochemistry and the results were quantified. The scale bar represents 100 μm. Data are presented as means ± SD of three experiments (*p < 0.05 and **p < 0.01).

