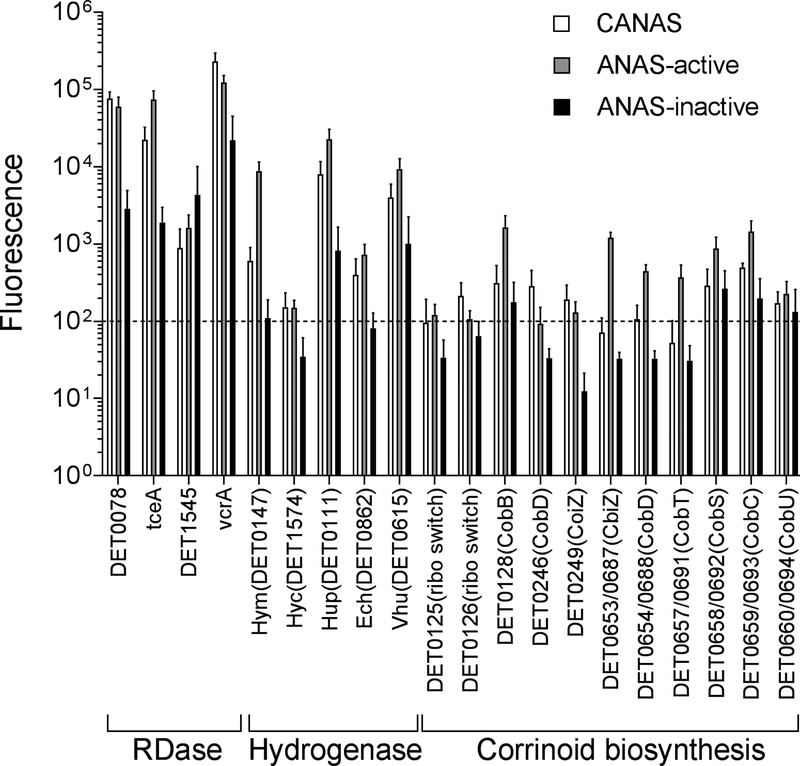
Figure 5.
Functional gene expression profiles of reductive dehalogenases (RDase) genes, oxidoreductase genes and corrinoid transport/biosynthesis genes in CANAS and ANAS during active dechlorination (20 hours after feeding substrate, ANAS-active (ANAS-20h)) and starvation (14 days after feeding substrate, ANAS-inactive (ANAS-0h)). Dashed line indicates significant fluorescence level (fluorescence signal > 100). Error bars represent the SD of biological triplicates.

