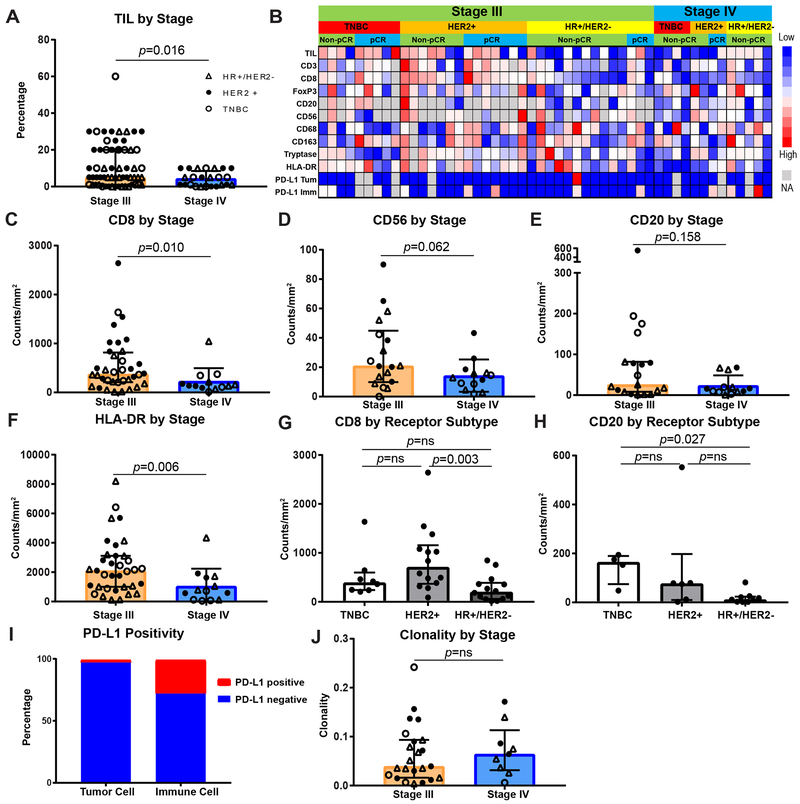
Figure 1. Stage III IBC has a higher infiltrate of lymphoid cells and MHC class II presentation, whereas hormone receptor positive disease has a lower lymphoid infiltrate.
A, Quantification by TIL percentage of stromal area of primary breast tissue from stage III or de novo stage IV disease (n = 62 stage III and 24 stage IV patients). Receptor subtypes are denoted with triangle indicating hormone receptor positive, HER2/neu non-amplified (HR+/HER2−) disease, closed circle indicating HER2/neu amplified (HER2+) disease, and open circle indicating triple negative breast cancer (TNBC). B, Supervised clustering by stage then receptor status and chemotherapy response of cases that received additional immunohistochemical (IHC) immune assessment (n = 37 stage III and 13 stage IV patients). TIL percentage, CD3, CD8, FoxP3, CD20, CD56, CD68, CD163, tryptase, HLA-DR, and PD-L1 expression on tumor and immune cells are shown, with red indicating higher infiltration and blue lower infiltration. C-F, Quantification of CD8+, CD56+, CD20+, and HLA-DR+ cells by stage (n = 36 stage III and 13 stage IV, 18 stage III and 13 stage IV, 19 stage III and 13 stage IV, 35 stage III and 13 stage IV, respectively). G, H, Quantification of CD8+ and CD20+ cells by tumor receptor status (n = 8 TNBC, 14 HER2+, 14 HR+/HER2+ for CD8+, 4 TNBC, 6 HER2+, 9 HR+/HER2− for CD20+ cells). I, Bar graph representing percentage of cases with PD-L1+ tumors and immune cells (n = 43). J, T-cell receptor clonality by stage (n = 23 stage III and 9 stage IV). A, C-H, J, Bar heights indicate median values, and interquartile ranges are presented in addition to individual data points. All comparisons were made using two-sided Mann-Whitney U test (if 2 groups) or Kruskal-Wallis test with adjustment for multiple testing (if more than 2 groups).

