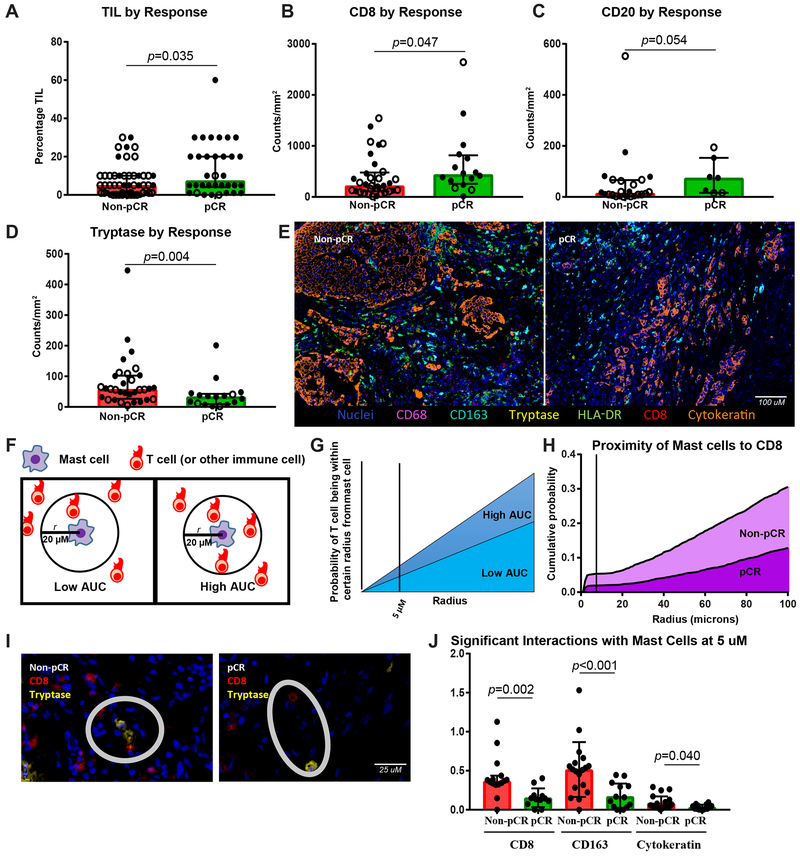
Figure 2. Mast cells are the strongest immune predictor of poor response to chemotherapy, with higher TILs seen in responders than nonresponders.
A-D, TIL percentage and densities of CD8+, CD20+, and tryptase+ cells by response, with response defined as achieving a pathologic complete response (pCR) or not (non-pCR) (n = 52 non-pCR and 34 pCR, 33 non-pCR and 16 pCR, 24 non-pCR and 7 pCR, 32 non-pCR and 17 pCR, respectively). Closed circle indicates stage III cases, and open circle stage IV cases. E, Representative multiplex immunohistochemistry image of a non-pCR and pCR case with nuclei (blue), CD68 (purple), CD163 (turquoise), tryptase (yellow), HLA-DR (green), CD8 (red), and cytokeratin (orange) stains depicted. F, G, Depiction of methodology for spatial analyses performed. Probabilities of a cell of interest being within a certain radius to another cell of interest were computed and area under the curve (AUC) calculated, with higher AUC indicating closer proximity. H, Non-pCR cases (n = 15) demonstrated higher AUC of mast cells to CD8+ T cells than pCR cases (n=12). I, Representative non-pCR and pCR cases showing distance between CD8+ T cell (red) and tryptase+ mast cell (yellow). J, Comparisons by response of AUC between mast cells and CD8+, CD163+, and cytokeratin+ (tumor) cells (n = 15 non-pCR and 12 pCR, 18 non-pCR and 14 pCR, 21 non-pCR and 14 pCR, respectively). A-D, J, Bar heights indicate median values, and interquartile ranges are presented in addition to individual data points. Comparisons were made using two-sided Mann-Whitney U test.

