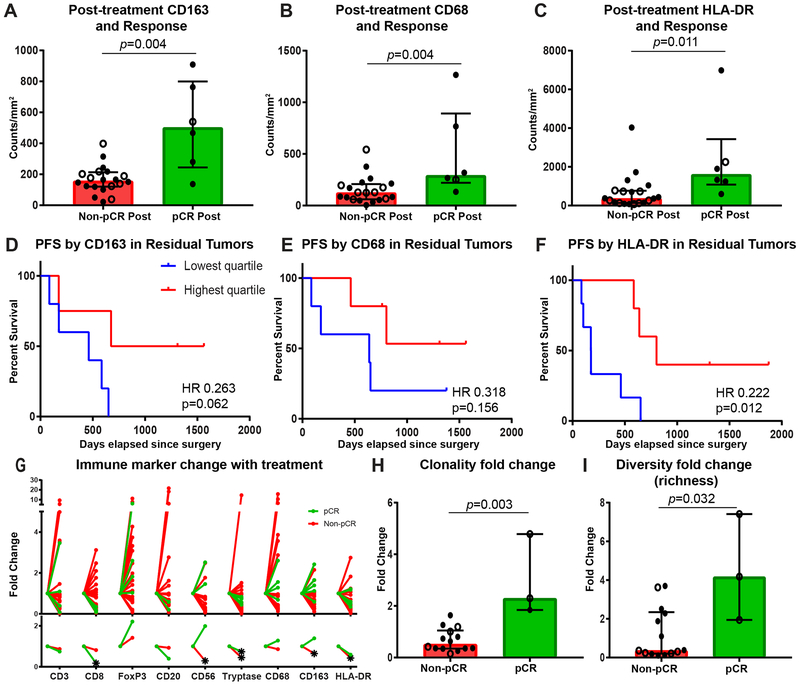
Figure 3. Higher post-treatment myeloid cells are associated with improved outcomes.
A-C, Densities of CD163+, CD68+, and HLA-DR+ cells in the tumor bed at time of mastectomy by response, with response defined as achieving a pathologic complete response (pCR) or not (non-pCR) (n = 20 non-pCR and 6 pCR). D-F, Kaplan-Meier estimates of progression-free survival from time of surgery using two-sided log rank test by residual densities of CD163+, CD68+, and HLA-DR+ cells in residual tumor of non-pCR cases (n = 20). G, Immune marker fold change from baseline to mastectomy tumor bed of non-pCR (red) and pCR (green) cases for density of CD3+ (n=19 non-pCR and 4 pCR), CD8+ (n=20 non-pCR and 5 pCR), FoxP3+ (n=19 non-pCR and 4 pCR), CD20+ (n=15 non-pCR and 2 pCR), CD56+ (n=14 non-pCR and 2 pCR), tryptase+ (n=18 non-pCR and 5 pCR), CD68+ (n=19 non-pCR and 5 pCR), CD163+ (n=19 non-pCR and 5 pCR), and HLA-DR+ (n=19 non-pCR and 5 pCR) cells. Individual data points are depicted in top panel and median fold change on bottom. Star indicates significant fold change from baseline, determined by one sample t test if variable normally distributed or Wilcoxon Signed Rank Test if not normally distributed by Shapiro-Wilk normality test. H, I, T-cell repertoire clonality and diversity fold changes from baseline to mastectomy tumor bed by response (n = 14 non-pCR and 3 pCR). A-C, H, I, Closed circle indicates stage III cases, and open circle indicates stage IV cases. Bar heights indicate median values, and interquartile ranges are presented in addition to individual data points. All comparisons were made using two-sided Mann-Whitney U test except where indicated.

