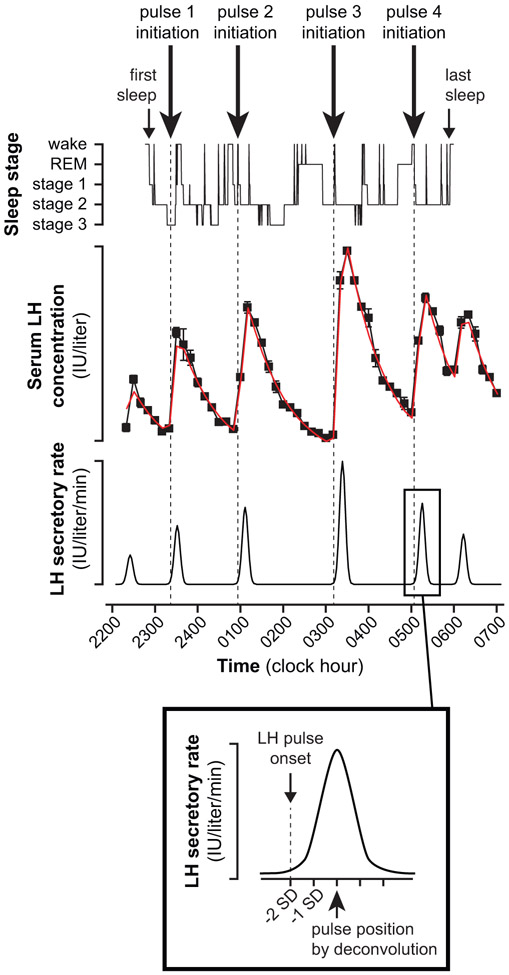
Figure 1. Example of aligned LH and PSG data.
In deconvolution, the rate of LH secretion from the anterior pituitary during a pulse is assumed to exhibit a Gaussian pattern; and deconvolution results include the pulse position—the center of the underlying secretory event (i.e., time of peak LH secretion rate)—and a secretory standard deviation (SD). The precise timing of sleep-associated LH pulse initiation (denoted by dashed vertical lines) was defined as two secretory SDs before pulse position.

