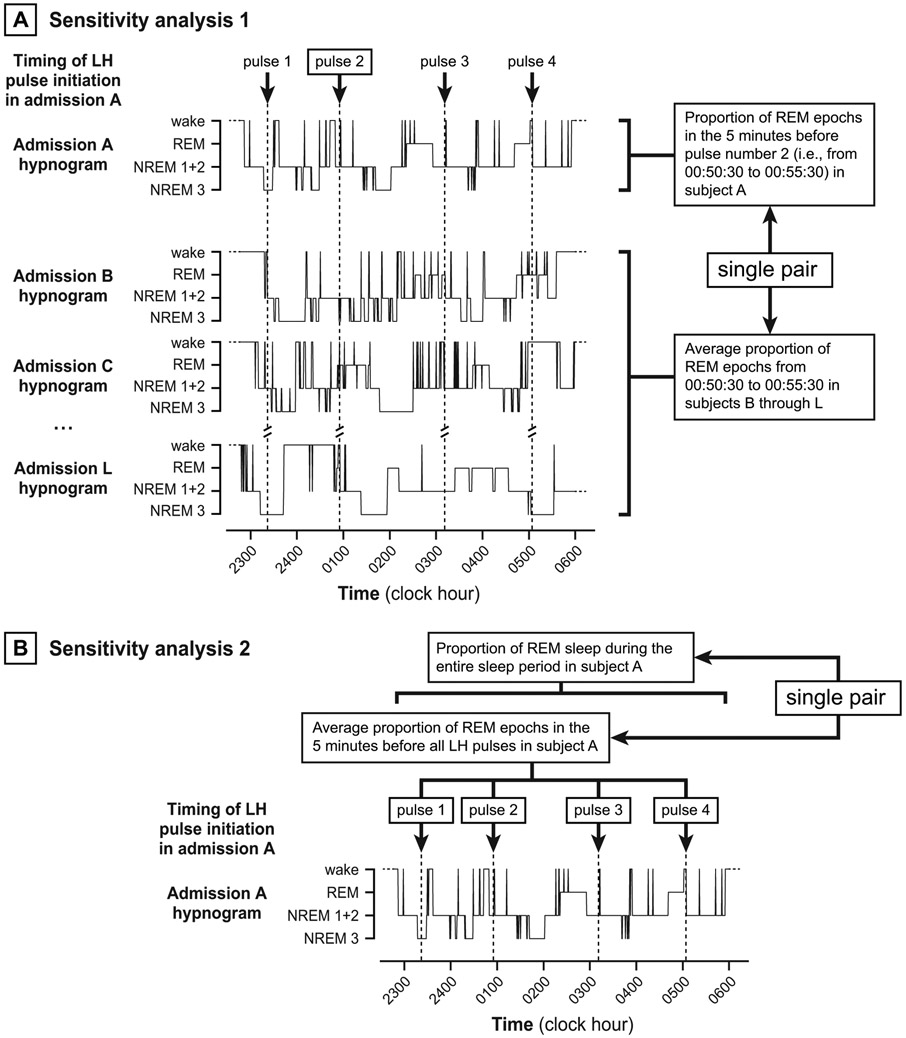
Figure 2. Depiction of sensitivity analyses.
Panel A. In the first sensitivity analysis, we paired (a) sleep stage proportions before each LH pulse to (b) average sleep stage proportions during the same time block for all other admissions. For each group (normal, PCOS), paired data were analyzed for consistent differences using Wilcoxon signed rank tests. Panel B. In the second sensitivity analysis, we paired (a) the average proportion of sleep stages before all LH pulses during an admission to (b) the proportion of sleep stages occupying the entire sleep period (same admission). For each group (normal, PCOS), paired data were analyzed for consistent differences using Wilcoxon signed rank tests.

