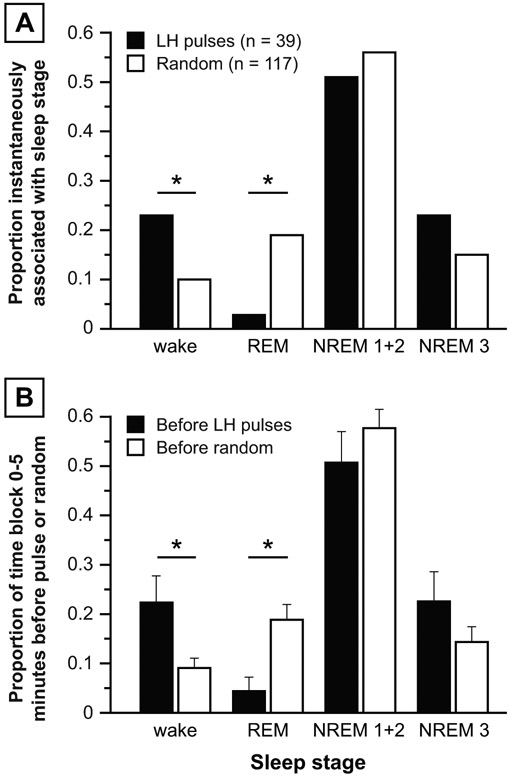
Figure 3: Primary analyses, normal women.
Panel A: Proportion of LH pulses (solid bars) vs. random time points (open bars) instantaneously associated with various sleep stages, calculated as the number of LH pulses (or random time points) instantaneously associated with a sleep stage divided by the total number of LH pulses (or random time points). Panel B: Proportion of time frame 0-5 minutes before LH pulses (solid bars) vs. random time points (open bars) occupied by each sleep stage. Data are expressed as mean ± standard error of the mean. * p < 0.05.

