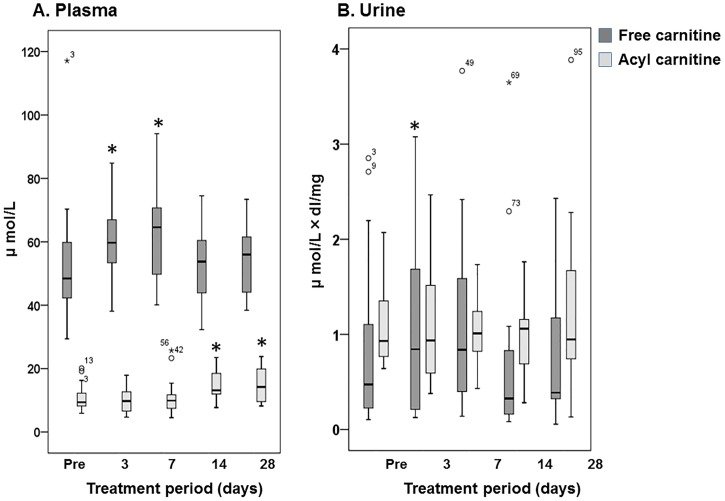
Fig 1. Changes in free and acyl carnitine in plasma creatinine (A) and urine, as assessed by urinary creatinine (B) after starting lenvatinib treatment.
The box spans data between two quartiles (IQR, interquartile range), and the bold line represents the median. The ends of the whiskers represent the largest and smallest values that are not outliers. Outliers are values between 1.5 and 3 IQRs from the end of the box. * p < 0.05; versus baseline (Pre).

