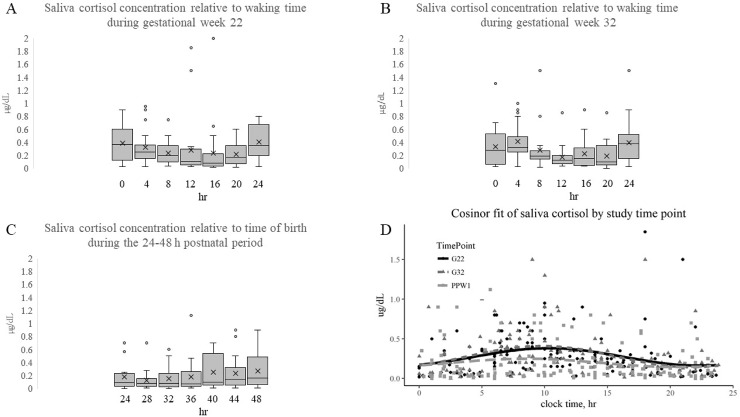
Fig 3. Saliva cortisol concentrations across a 24 h period during gestational weeks 22 and 32, and 24–48 h postpartum.
Box plots of saliva cortisol relative to time of waking (0 h) during gestational week 22 (A) and 32 (B); or relative to time of birth, beginning at 24 h postpartum. Horizontal line within box plot indicates median, X indicates mean, and dots are outliers. Scatter plot of saliva cortisol levels versus clock time (D), with cosine fitted curve of data collected during gestational week 22 (red), 32 (black) and post-partum 24–48 h (blue).

