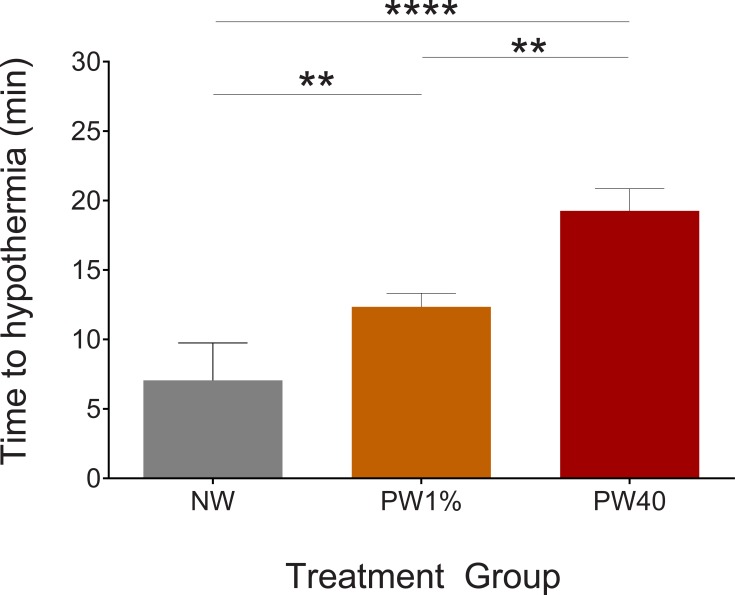
Fig 2. Time to reach individual hypothermia threshold.
The no-warming (NW, n = 17) group reached their individual hypothermia threshold more quickly than the pre-warming to 1% above baseline core temperature (PW1%, n = 17) (p < 0.01) and pre-warming to 40°C (PW40, n = 17) (p < 0.0001) groups. The PW1% group reached their individual hypothermia threshold more quickly than the PW40 group (p < 0.01). Data presented as mean ± SEM. **p < 0.01. ****p < 0.0001.

