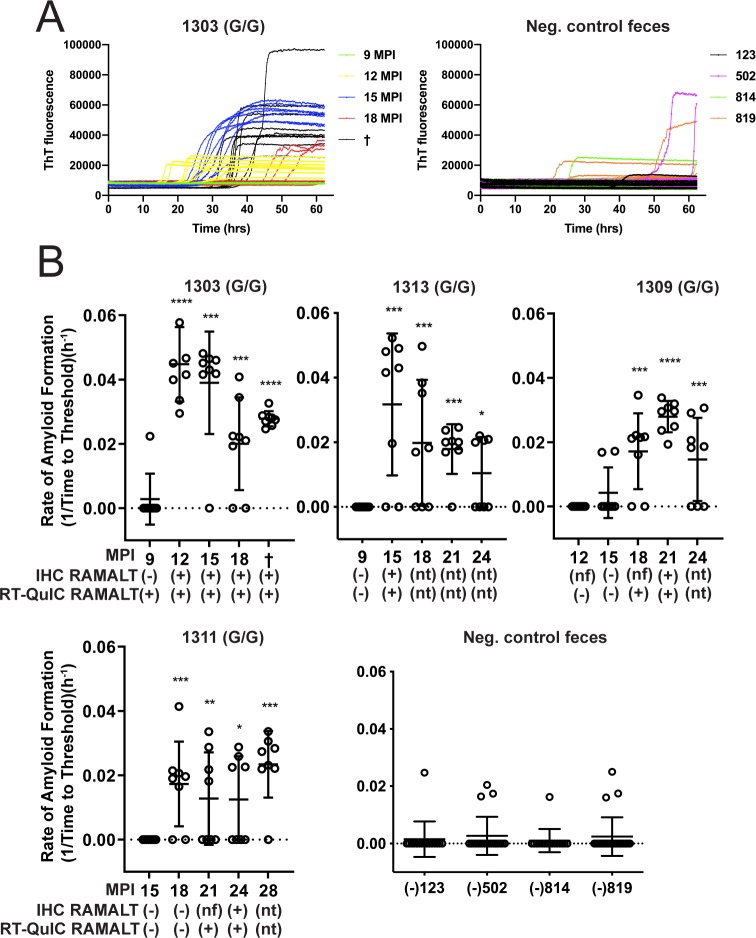
Fig 1. Longitudinal CWD prion fecal shedding in 96 GG deer.
(A) Representative RT-QuIC data curves from CWD positive deer, 1303, at multiple sampling timepoints and negative controls. Data from these graphs is converted to reaction rates by 1/time to cross the threshold (5 SD above the mean background) and shown below. (B) Five collection time points encompassing shedding of fecal prions are displayed for deer 1303, 1313, 1309, and 1311—a representative cohort of 96GG deer in the study. Y-axis displays amyloid formation rate for CWD seeding activity at each sampling time point displayed on the x-axis as months post inoculation (MPI). Below MPI, IHC and RT-QuIC data are displayed for RAMALT biopsies taken at the same collection. IHC or RT-QuIC testing nt: signifies that no sample was taken for IHC or RT-QuIC due to positive results on a prior test. Nf: signifies that no follicles were present in the biopsy following microscopic examination and therefore no IHC interpretation could be conducted. Negative control fecal samples were also tested from deer that were CWD negative (deer # 123, 502, 814, and 819). Data shown is the amyloid formation rate of 8 replicates with mean ± SEM; * p<0.05, ** p<0.01, *** p<0.001, **** p<0.0001.

