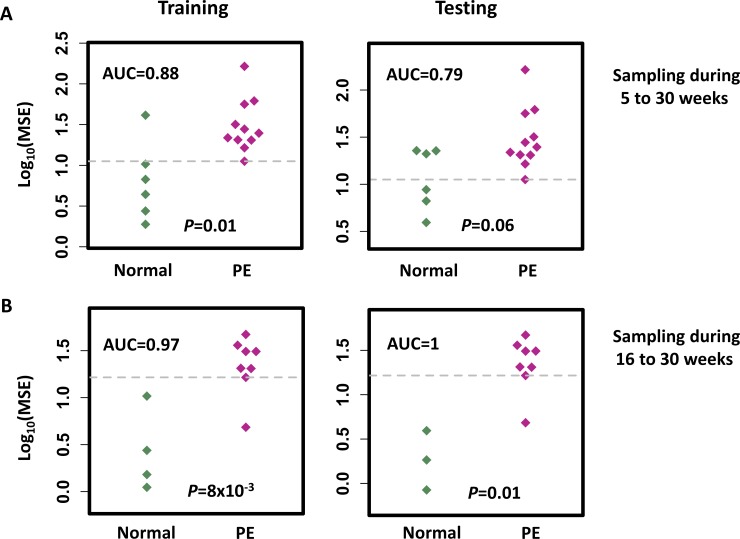
Fig 4. The mean squared error (MSE) of the EN model in estimating the GA of normal and PE patients in the training and testing cohorts, respectively.
Mann-Whitney U-test P-value was calculated to measure the difference in MSE between the normal and PE patients. The cut-off point (grey dotted line) shows the maximum value of the sum square of the sensitivity and 1-specificity on classification of the training cohort of normal and PE women at blood sampling during (A) 5–30 and (B) 16–30 weeks of gestation.

