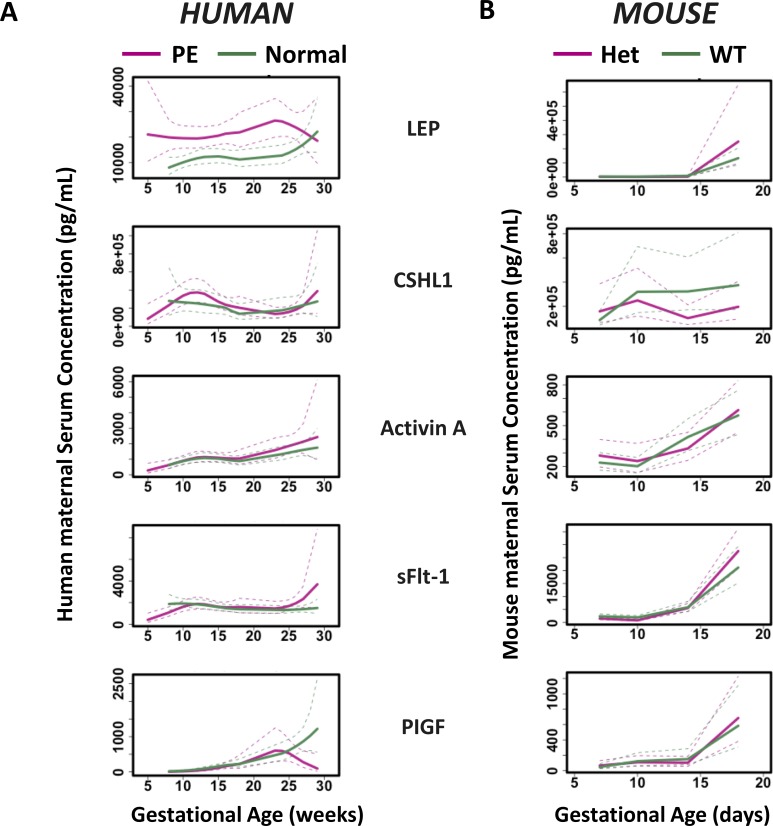
Fig 5.
Loess smoothing of the serum levels of the 5 placenta-related proteins in (A) human and (B) mice as a function of GA for both normal and (A) PE or (B) HO-1 Het samples. The x axis represents GA, and the y axis represents serum concentrations. Red curves represent patterns of PE women and HO-1 Het mouse. Green curves represent patterns of normal pregnant women and WT mouse. Dotted lines represent 95% confidence intervals.

