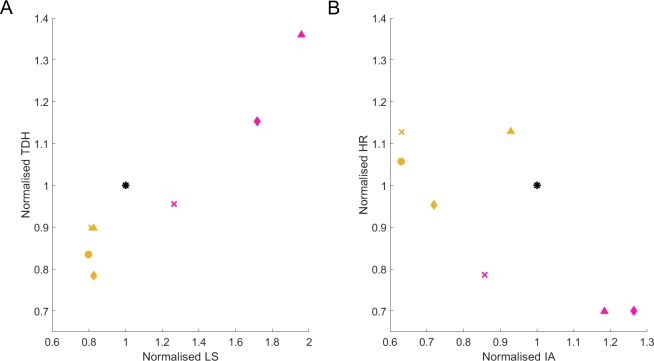
Fig 11. Normalized IA helps distinguish treated populations from controls.
(A) The mean normalized lifespan (x-axis) vs total days of health (y-axis) and (B) normalized IA (x-axis) vs normalized HR (y-axis), are shown in relation to EV control populations (black, coordinates 1:1:1, all normalizations to internal controls). Average normalized values for populations treated with daf-2 (pink) or daf-16 (yellow) RNAi from Experiment I (‘◊’), Experiment II (‘Δ’), Experiment III(‘x’) or Experiment IV (‘o’) are used as coordinates.

