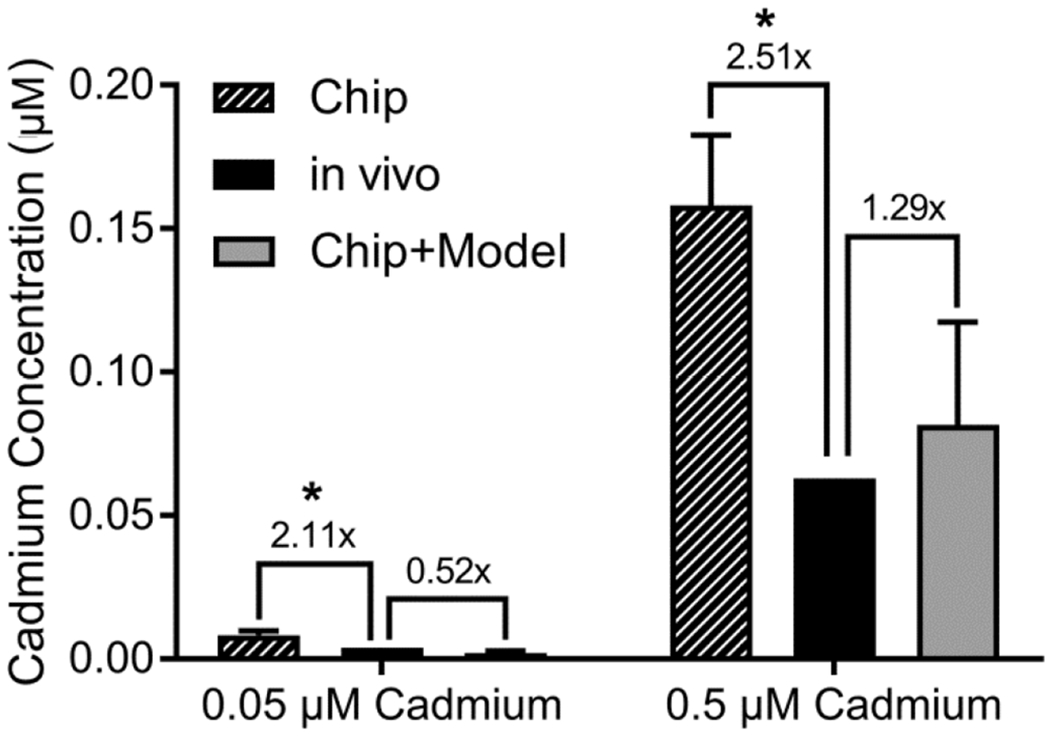
Figure 7.

Measured and predicted cadmium concentrations in chip effluent and urine. In each panel, comparison is made between the cadmium concentrations measured in chip effluent (solid bars), cadmium concentrations in urine calculated using the PBPK model of Ruiz et al. (2010) (open bars), and cadmium concentration in urine predicted from chip data combined with the physiologically-based model for renal clearance in Figure 1. Data is reported as mean ± SD (n=8). The comparison between Chip and in vivo predictions were statistically significant (*), but the comparison between Chip+Model and in vivo predictions were not significant.
