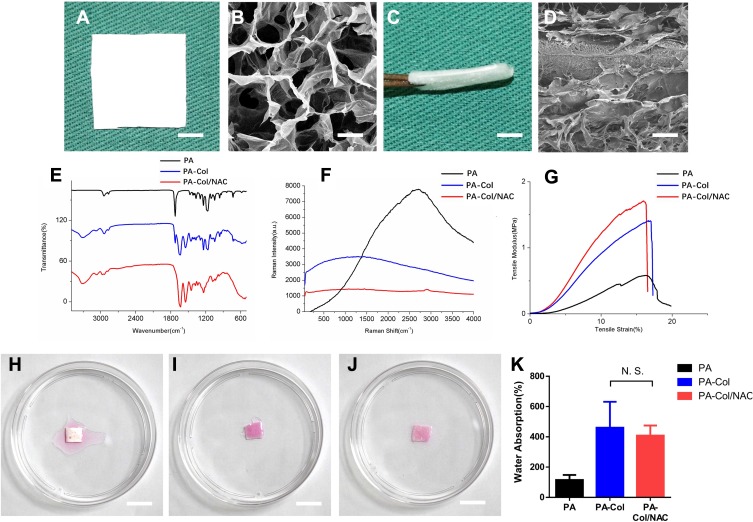
Figure 2.
(A and C) Macro photograph of PA-Col/NAC scaffolds from vertical view and from the side view (scale bar 1 cm). (B and D) Magnified view of A and C (scale bar 100 nm). (E) ATR-FTIR spectroscopy, (F) Raman spectroscopy and (G) tensile stress-tensile modulus curve of the scaffolds was displayed. (H–J) Water absorption of three scaffolds indicated by stained normal saline (scale bar 1 cm). (K) Water absorption histogram of three scaffolds.
Abbreviation: N.S., not significant.

