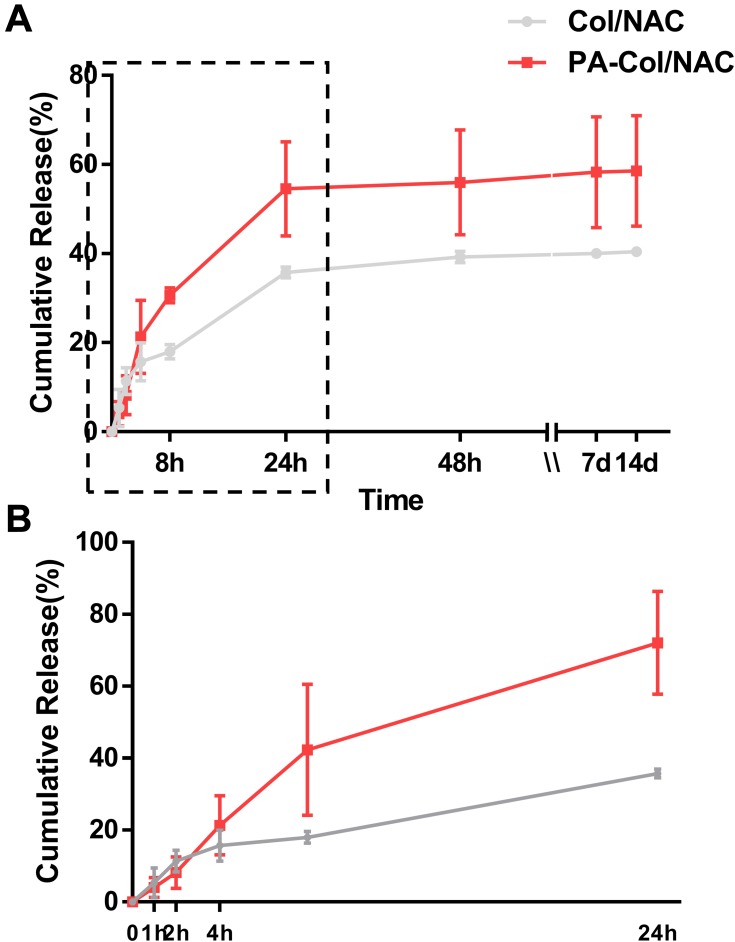
Figure 5.
Time-dependent cumulative release profiles of NAC by PA-Col/NAC and Col/NAC.
Notes: (A) Whole time of the cumulative release profile; (B) first 24 hours of the profile. The gray curve demonstrated that NAC has been released up to 35.75%±0.84% in 24 h and followed by sustained release up to 40.41%±0.49% in 14th day, while the red curve indicated that NAC has been released up to 54.53%±7.45% in 24 h and followed by sustained release up to 58.56%±8.77% in 14th day.

