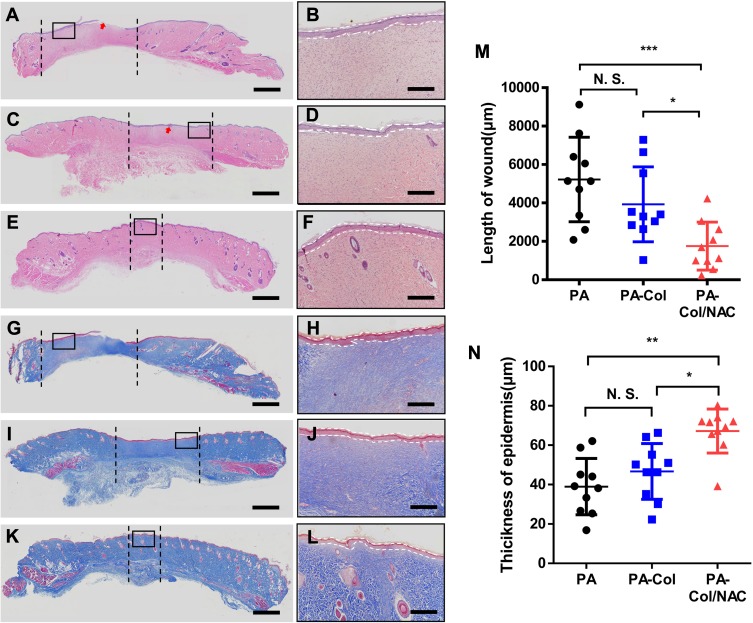
Figure 7.
Histological analysis revealed that the PA-Col/NAC group reached better repair effect at day 14.
Notes: (A–F) H&E staining and (G–L) Masson staining of wound section after 14 days treatment. Red arrows: remaining scaffolds. The section between the black dash lines: unhealed area. Scale bars: 1000 μm. Magnified view of the region in (A, C, E, G, I, and K) shows thickness of epidermal layer indicated by white dash lines. Scale bars: 400 μm. (A, B, G and H) PA group. (C, D, I and J) PA-Col group. (E, F, K and L) PA-Col/NAC group. Analysis of (M) length of wound and (N) thickness of epidermis is shown. Mean ± SD; *P<0.05; **P<0.01; ***P<0.001.
Abbreviation: N.S., not significant.

