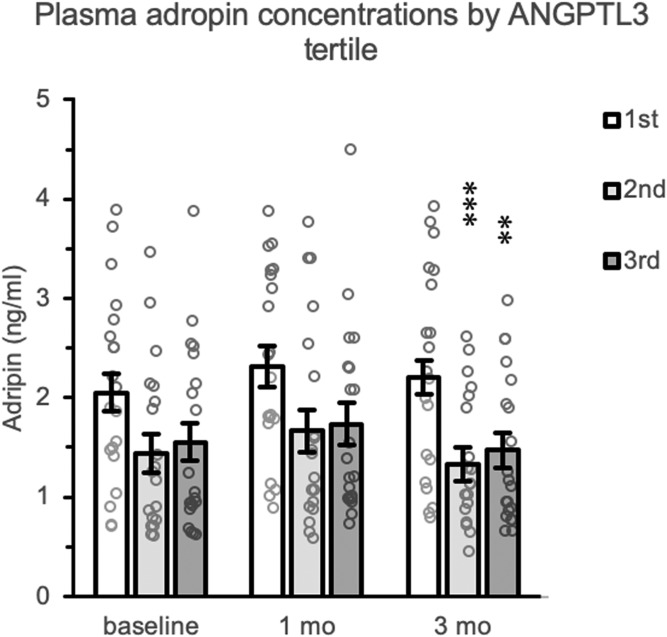
Fig. 3.
Low plasma ANGPTL3 concentrations correlate with high plasma adropin concentrations in situations of fructose-induced metabolic dysregulation. The data shown as bar graphs are estimated marginal means for fasting plasma adropin concentrations at baseline and after 1 and 3 months of fructose. Individual unadjusted data points are also shown (gray circles). The animals were separated in tertiles ranked low to high by baseline plasma ANGPTL3 concentrations. There was a significant effect of tertile at the 3-month time point (P = 0.001); animals with low plasma ANGPTL3 concentrations had significantly higher plasma adropin concentrations. **P < 0.005 and ***P = 0.001 compared with the 1st tertile.

