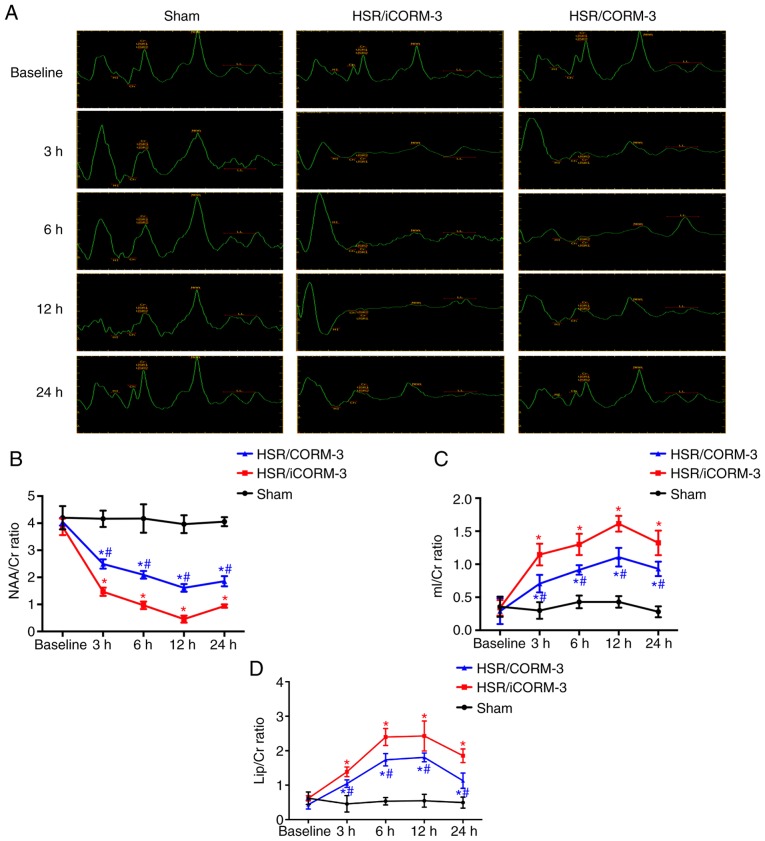
Figure 7.
Time course of in vivo localized 1H MR spectra in the hippocampus induced by the indicated stimuli. (A) Representative 1H MR spectra of the hippocampus in the coronal view at 3, 6, 12 and 24 h after HSR treatment. (B-D) The time course of NAA/Cr, mI/Cr, and Lip/Cr ratios caused by the indicated stimuli. Data are presented as mean ± SD (n=6 per group). *P<0.05 vs. Sham; #P<0.05 vs. HSR iCORM-3. CORM, carbon monoxide-releasing molecule; HSR, hemorrhage shock and resuscitation; iCORM-3, inactive CORM-3; NAA, N-acetylaspartate; mI, myoinositol; Lip, lipid; Cr, creatinine.

