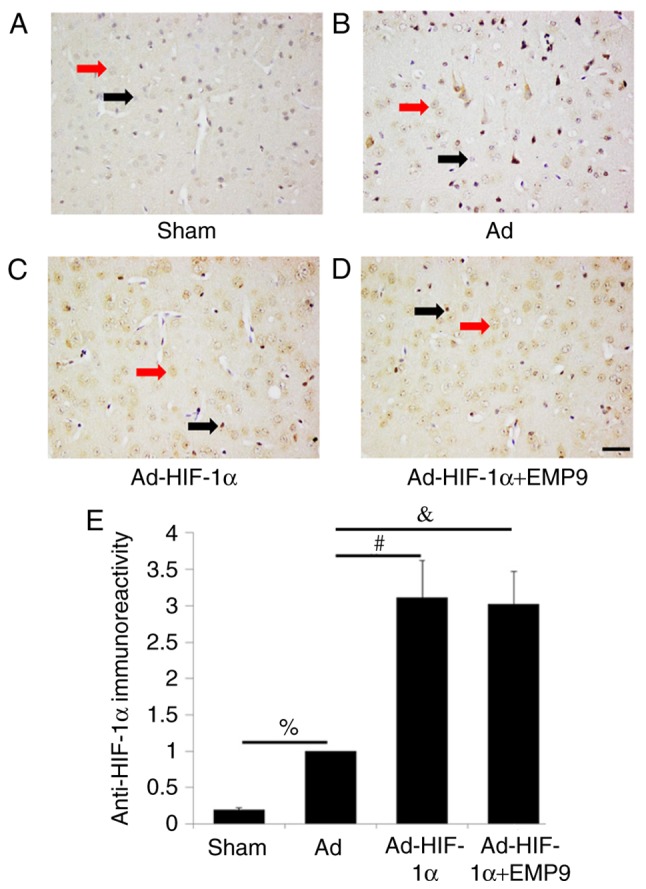
Figure 4.

Ad-HIF-1α treatment enhanced HIF-1α expression following MCAO. (A) In the Sham group, a very low expression of HIF-1α was revealed in cytoplasm of neurons. (B) There were some HIF-1α-positive cells in the brains of rats treated with Ad. (C) There were substantially more HIF-1α-positive cells in Ad-HIF-1α-treated rats compared with rats treated with Ad. (D) EMP9 treatment did not change HIF-1α expression increased by Ad-HIF-1α. (E) Quantified HIF-1α expression levels. %P<0.05, #P<0.05 and &P<0.05 with comparisons shown by lines. Red arrows indicate HIF-1α expression in neurons. Black arrows indicate HIF-1α expression in glia cells. Scale bar, 50 µm. MCAO, middle cerebral artery occlusion; Ad, adenovirus; HIF-1α, hypoxia-inducible factor-1α; EMP9, erythropoietin mimetic peptide-9.
