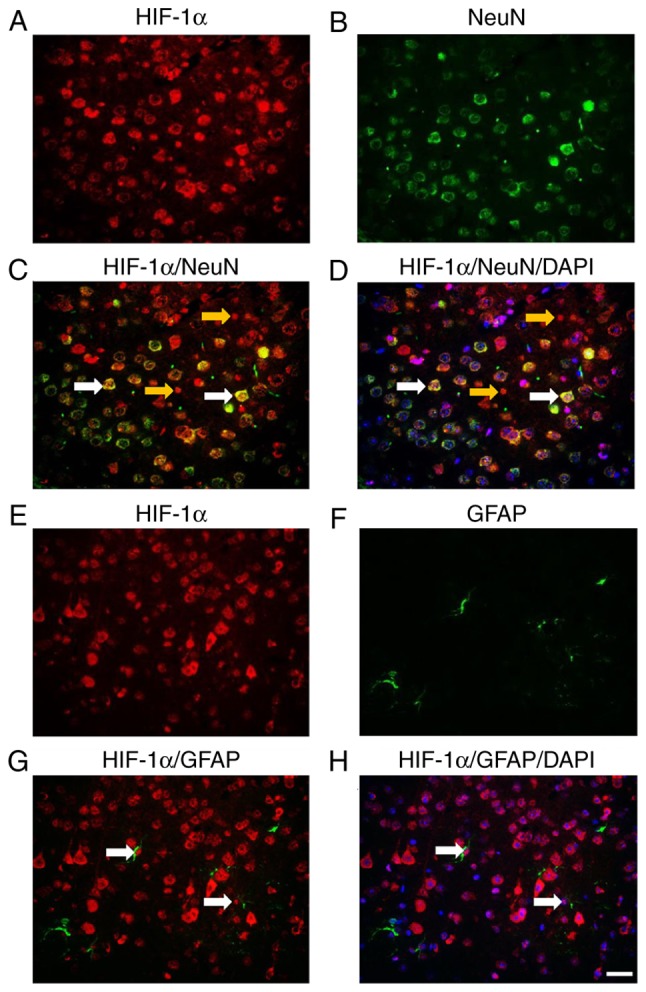
Figure 5.

Expression of HIF-1α in neurons and astrocytes. (A) HIF-1α and (B) NeuN double-labeled fluorescence staining in Ad-HIF-1α treated rat brains. (C) Colocalization of HIF-1α (red) and NeuN (green) (white arrows). (D) Colocalization of HIF-1α (red), NeuN (green) and DAPI (blue) (white arrows). Yellow arrows indicate cells that were HIF-1α-positive but NeuN- negative. (E) HIF-1α and (F) GFAP double-labeled fluorescence staining in Ad-HIF-1α treated rat brains. (G) Colocalization of HIF-1α (red) and NeuN (green) (white arrows). (H) Colocalization of HIF-1α (red), NeuN (green) and DAPI (blue) (white arrows). Scale bars: 50 µm. Ad, adenovirus; HIF-1α, hypoxia-inducible factor-1α; NeuN, RNA binding fox-1 homolog 3; GFAP, glial fibrillary acidic protein.
