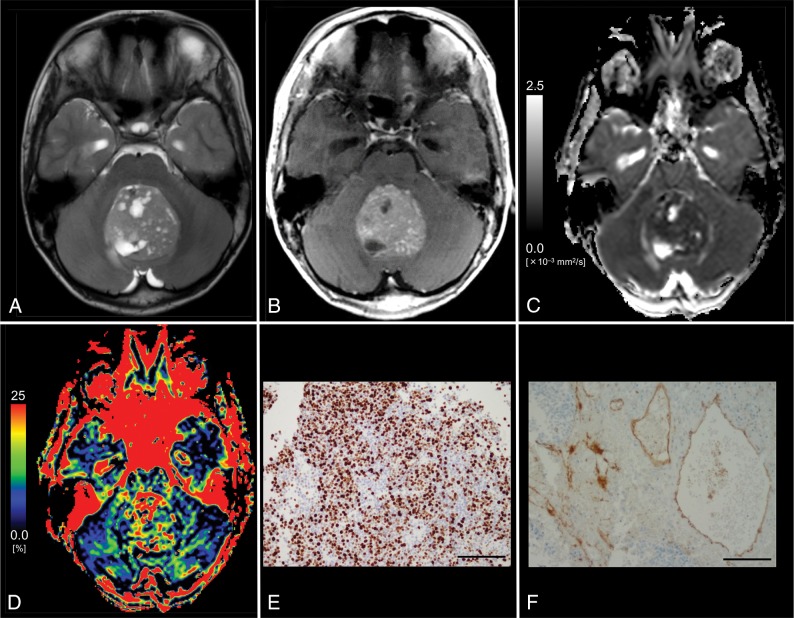
Fig 2.
Images from an 11-year-old boy with histologically defined classic medulloblastoma (WHO grade IV). A, T2WI shows a heterogeneous, hyperintense mass in the vermis. B, Contrast-enhanced T1WI shows heterogeneous enhancement of the tumor. C, The D map shows the low D value (0.53 × 10⁻³ mm2/s) of the lesion, which is lower than the cutoff value (≤1.15 × 10⁻³ mm2/s; Table 3). D, The f map shows the f value (27.1%) of the lesion, which is higher than the cutoff value (>14.1%; Table 3). E, MIB-1 staining reveals a high MIB-1 index (72.6%). F, Immunohistochemical staining for anti-CD31 shows a high MVD (10.2%). Bar = 100 μm.

