
Figure 2.
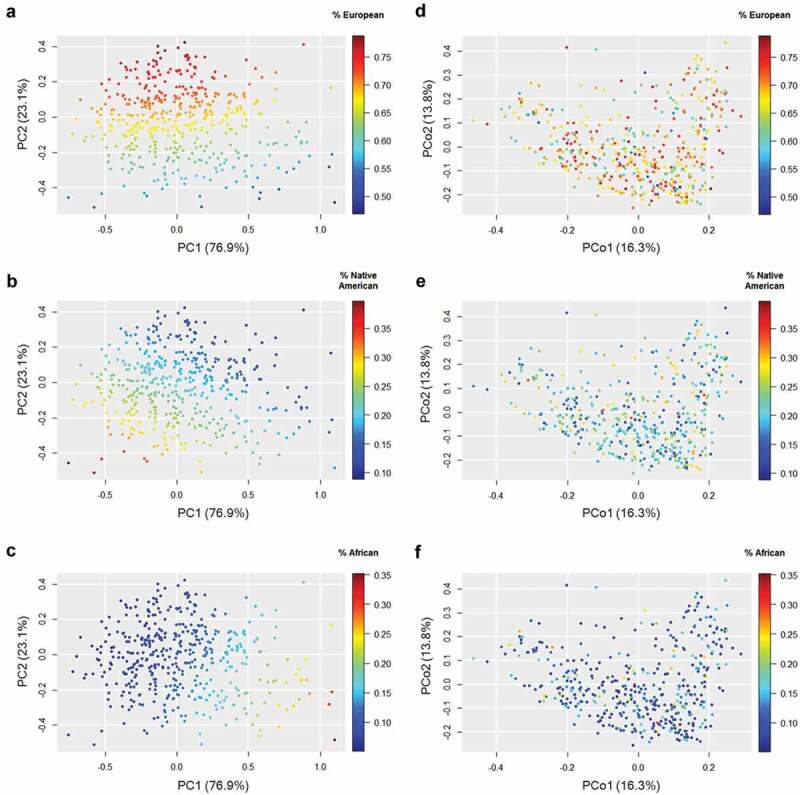
Ancestral genetic composition and gut microbiota composition in the studied population. Each set of panels shows the same cloud point colored by the contributions of each genetic ancestry. Robust principal components analysis (PCA) for compositional data based on the proportions of European (A), Native American (B) and African (C) ancestries. Principal coordinate analysis (PCoA) based on weighted UniFrac distances of the gut microbiota for European (D), Native American (E), and African (F) ancestries. The percentages on the axes represent the proportion of explained variation. Note the change in the scale among panels.