
Figure 3.
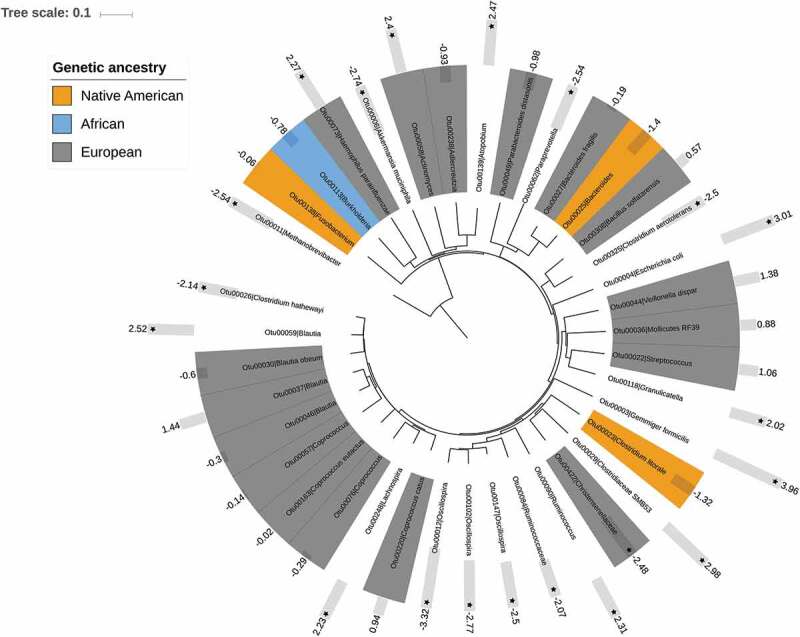
Neighbor-joining tree showing OTUs with significant associations with ancestry and cardiometabolic health.25 OTUs with a colored background were those associating with a particular ancestry (see legend). The bars denote CMS risk scale values (negative values = low risk, positive values = high risk) and their statistical significance (stars = p < .05 and q< 0.10).