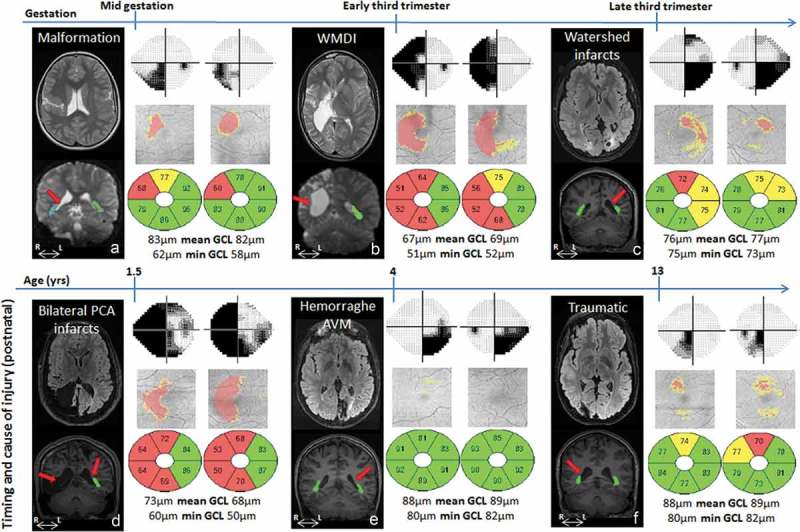
Figure 1.

Brain injury on MRI, visual field defects and GCL+IPL topography and layer thickness presentation for cases A-F. GW = gestational week, yrs = years, WMDI = white matter damage of immaturity, PCA = posterior cerebral artery, AVM = arteriovenous malformation, OR = optic radiation. Cases A to F are presented according to the timing of the damage (see Table 1). For each case the brain injury is presented on representative conventional MRI (first panel, top row), the reconstructed ORs are super-imposed on conventional MRI (first panel, bottom row) with red arrows indicating the location of injury (see Table 1 for descriptive analysis). Visual fields are presented in grey scales, with black indicating visual field defects. Below the GCL+IPL topography, with red indicating thinning, the thickness values for each macular area are presented. Green colour indicates values within the normal range, yellow borderline and red thin. Mean GCL+IPL values and minimum values for each eye are given in microns. There was a correlation between the sectors with GCP+IPL thinning (indicated by red and yellow in the grey fundus photos) and the visual field defects (indicated with dark/black colour in the greyscale map) in all except one case (E). However, in that case, there was an abnormal asymmetry in GCL+IPL thickness between the sectors, with a correlation between the thinnest sectors and the visual field damage.
