Figure 1.

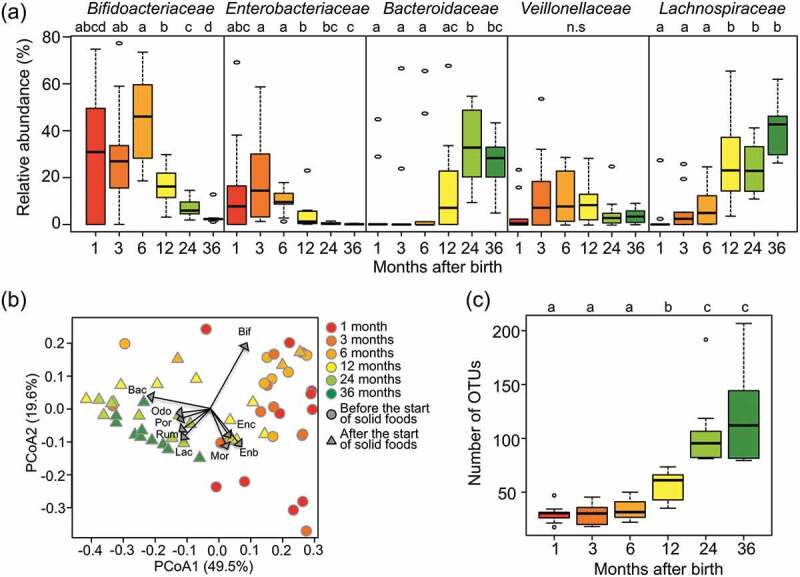
Fecal microbiota compositions over the first 3 y of life.
(a) Succession of top five bacteria families in the first 3 y. Box plots show the distribution of the relative abundance of Bifidobacteriaceae, Enterobacteriaceae, Bacteroidaceae, Veillonellaceae, and Lachnospiraceae among the ten subjects at the indicated age. Different letters (a–d) indicate significant differences between ages (p < 0.05, Wilcoxon rank-sum test with Benjamini–Hochberg correction). n.s: non-significantly. (b) Principal Coordinate Analysis (PCoA) plots based on weighted Unifrac distances, calculated using the OTU compositions and phylogeny. Circle plots showed samples before the start of solid food intake and triangle plots showed samples after that. Regression of sample distribution in the PCoA plot to relative abundance of each bacteria family was calculated using the Envfit R program, and loading of bacteria families whose R2 was higher than 0.01 were plotted by dashed arrow vector. Differences in community structures between before and after the start of solid foods were analyzed statistically using the ‘adonis’ function with 999 permutations in the QIIME pipeline. Bif: Bifidobacteriaceae, Enc: Enterococcaceae, Enb: Enterobacteriaceae, Mor: Moraxellaceae, Lac: Lachnospiraceae, Rum: Ruminococcaceae, Por: Porphyromonadaceae, Odo: Odoribacteraceae, Bac: Bacteroidaceae. (c) Alpha-diversity of fecal microbiota in the first 3 y of life. Distribution box plots showing the number of OTUs detected in each subject are displayed at each sampling point. Different letters (a–c) indicate significant differences between ages (p < 0.05, Wilcoxon rank-sum test with Benjamini–Hochberg correction).
