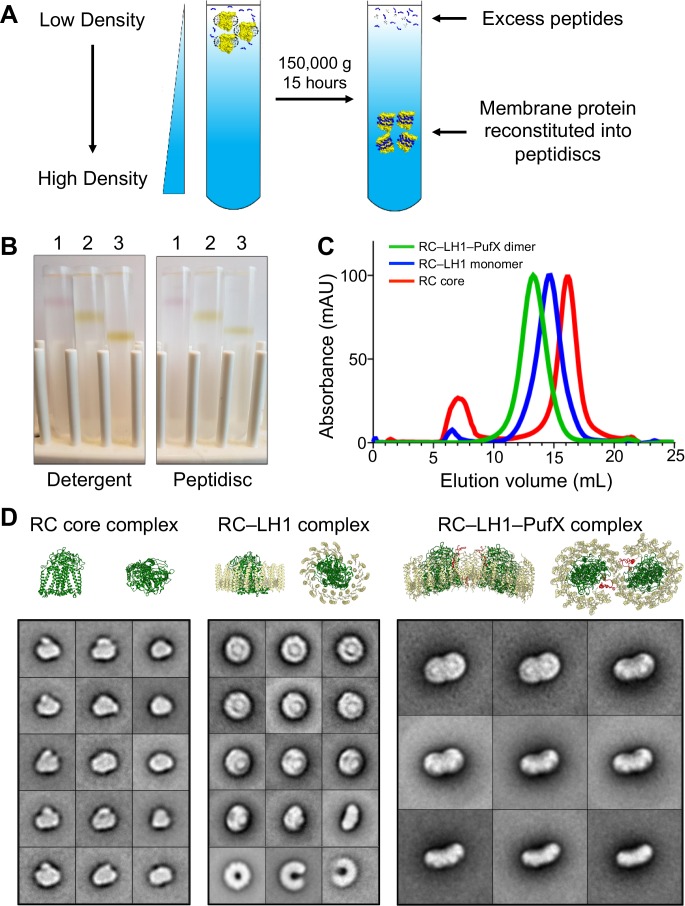
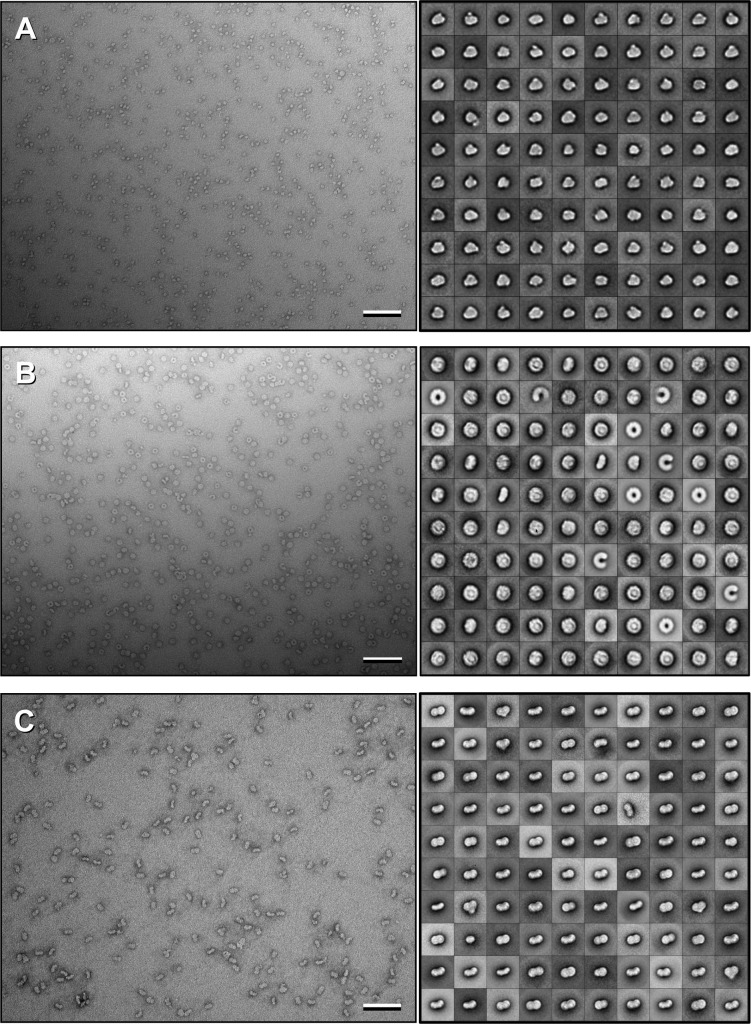
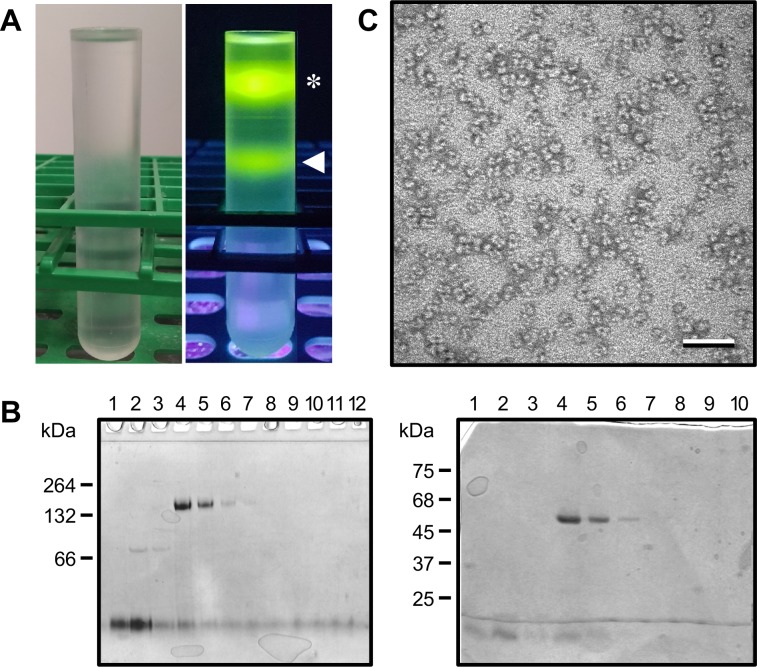
Figure 1. Reconstitution of Rhodobacter spheroides reaction center (RC) complexes into peptidiscs by using the ‘on-gradient’ method.
(A) Schematic drawing showing the principle of the on-gradient reconstitution method: detergent-solubilized membrane protein is mixed with an excess of peptidisc peptide and the mixture is overlaid onto a detergent-free linear sucrose gradient. Upon centrifugation, the protein reconstitutes into peptidiscs and localizes to a discrete band in the gradient, whereas excess peptides and detergent micelles stay at the top. (B) Gradients of the colored R. sphaeroides RC complexes showing their migration in the presence of detergent (left panel) and after reconstitution into peptidiscs (right panel). 1: RC core complex (99 kDa), 2: monomeric RC–LH1 complex (258 kDa), and 3: dimeric RC–LH1–PufX complex (521 kDa). (C) Size-exclusion chromatography profiles of RC complexes reconstituted into peptidiscs. Traces are normalized to 100 mAU. (D) Selected 2D-class averages of the three RC complexes (see Figure 1—figure supplement 1 for all 100 class averages). For comparison, ribbon representations are shown for the R. sphaeroides RC (PDB: 1K6L; Pokkuluri et al., 2002), the Rhodopseudomonas palustris RC–LH1 complex (PDB: 1PYH; Roszak et al., 2003) and the R. sphaeroides RC–LH1–PufX complex (PDB: 4V9G; Qian et al., 2013). RC: green, LH1: yellow, and PufX: red. The bottom row of the class averages for the RC–LH1 complex show empty LH1 rings that were present in the preparation. The side lengths of the individual class averages are 24.4 nm for the RC core complex, 32.5 nm for the monomeric RC–LH1 complex, and 48.8 nm for the dimeric RC–LH1–PufX complex.


