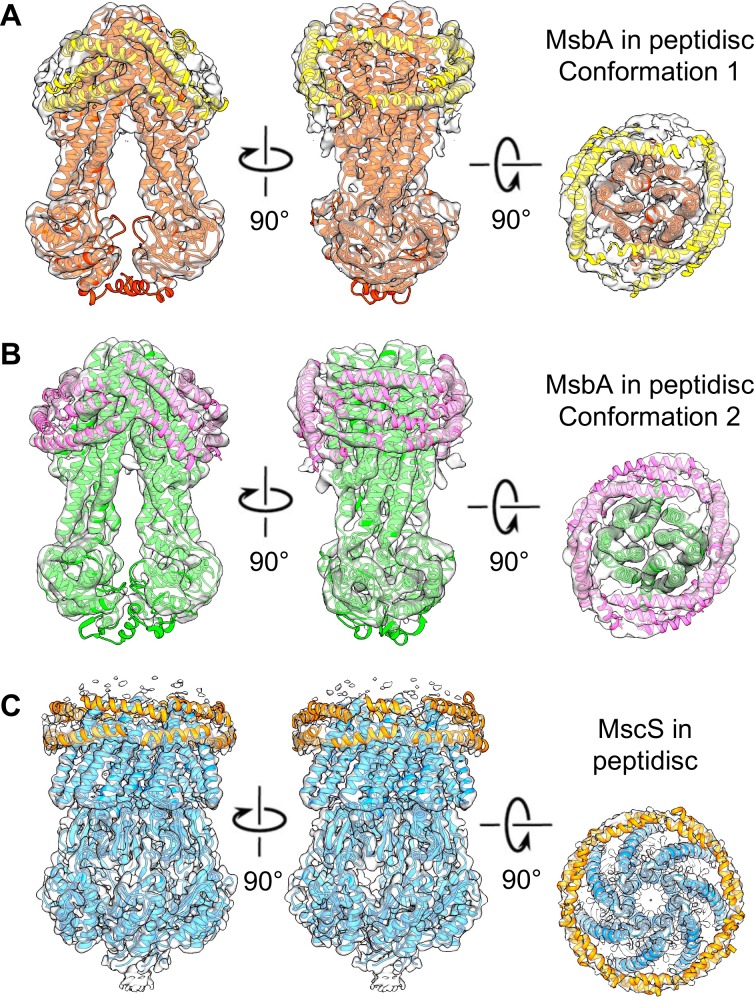
Figure 3. The peptidisc densities surrounding MsbA and MscS.
Different views of the density maps of (A) MsbA in conformation 1 (red ribbon representation), (B) MsbA in conformation 2 (green ribbon representation), and (C) MscS (blue ribbon representation). Densities consistent with helical segments surrounding the membrane proteins and representing peptidisc peptides were fit with poly-alanine models (yellow ribbon representation).

