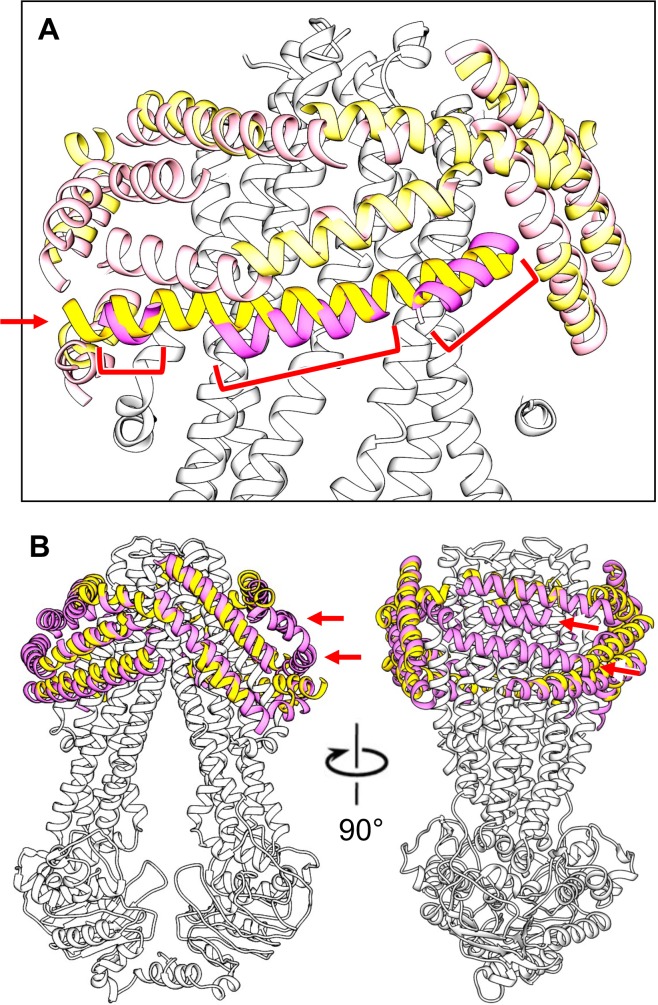
Figure 4. Comparison of modeled peptide helices surrounding MsbA in conformations 1 and 2.
(A) The longest helical segment found in the peptidisc density surrounding MsbA in conformation 1 (yellow helix indicated with red arrow) overlaps with three helical segments found in the peptidisc density surrounding MsbA in conformation 2 (magenta helices indicated with red brackets). (B) Orthogonal views of the superimposition of the modeled peptidisc peptide helices in the map of MsbA in conformation 1 (yellow helices) with those in the map of MsbA in conformation 2 (magenta helices) showing that many helices in the two maps overlap. The map of MsbA in conformation 2 shows two helical segments that are not present in the map of MsbA in conformation 1 (indicated by red arrows).

