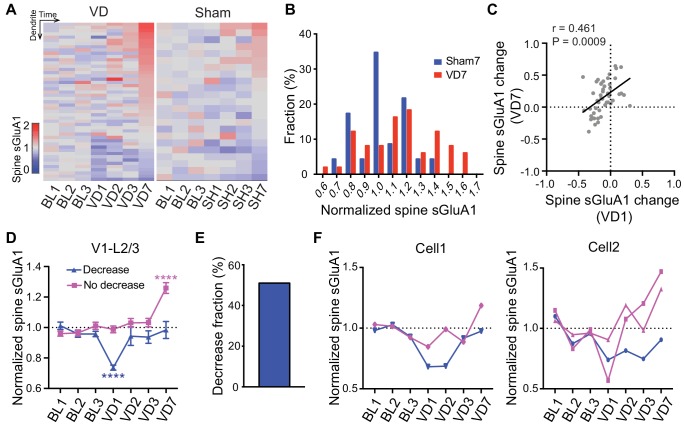
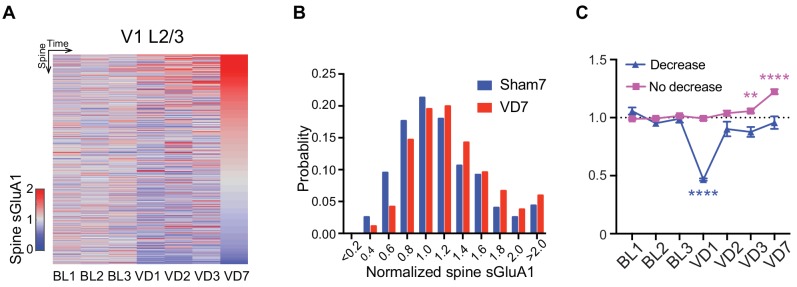
Figure 4. Heterogeneous responses of individual spines to visual deprivation.
(A) Heat map of change in sGluA1 level within individual dendrites in VD and sham-surgery (SH) groups. (B) Histogram of spine sGluA1 changes in dendrites 7 days after VD or sham-surgery (n = 23 dendrites in sham group; n = 49 dendrites in VD group; Kolmogorov-Smirnov test, p=0.079). (C) Correlation between spine sGluA1 changes of individual dendrites at day 1 and day 7 after VD (n = 49 dendrites; Pearson). (D) Changes of spine sGluA1 expression in dendrites that show decrease or no decrease at day 1 following VD in V1 L2/3 neurons. (n = 25 decrease dendrites and n = 24 no decrease dendrites from eight mice; one-way ANOVA). (E) Percentage of dendrites that decrease spine sGluA1 after 1 day of VD (51.02%). (F) Changes in spine sGluA1 of individual dendritic segments from the same V1 L2/3 neuron following binocular enucleation. Each line indicates individual dendritic segment. Data are presented as mean ± SEM. ****p<0.0001.


