. 2020 Mar 3;9:e52420. doi: 10.7554/eLife.52420

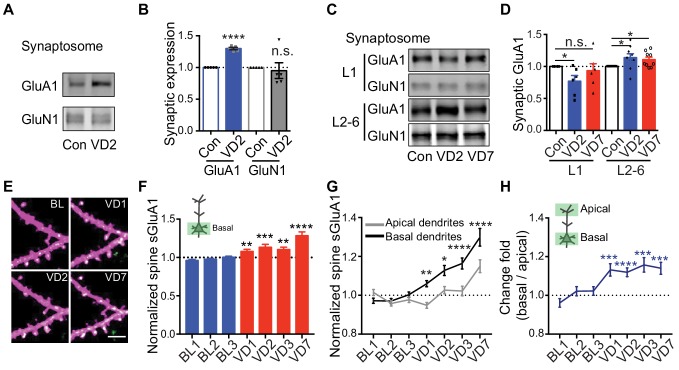
Figure 5. Depth-dependent changes in spine sGluA1 expression after visual deprivation.

(A and B) Synaptic GluA1 and GluN1 levels in V1 from 2 days’ enucleated or sham-surgery mice (n = 5; Student’s t-test). (C and D) Synaptic GluA1 levels from superficial (L1) and deep (L2-6) layers of V1 (n = 6–9; Student’s t-test). (E and F) Changes in spine sGluA1 on basal dendrites of V1 L2/3 neurons following VD (n = 40 dendrites from six mice; one-way ANOVA). Scale bar: 5 μm. (G) Changes in spine sGluA1 on basal and apical dendrites from the same neurons following VD (n = 16 neurons from seven mice; repeated measure two-way ANOVA). (H) Change ratios of basal dendrites to apical dendrites of the same neurons following VD were significantly larger than 1 (n = 16 neurons from seven mice. one sample t-test). Data are presented as mean ± SEM. n.s., not significant; *p<0.05; **p<0.01; ***p<0.001; ****p<0.0001.

Figure 5.

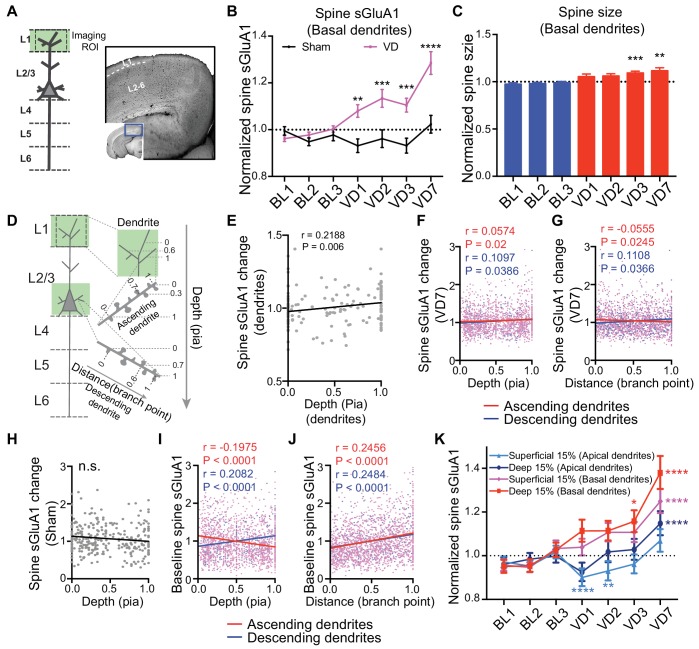
Figure 5—figure supplement 1. Depth-dependent increase of spine sGluA1 in V1-L2/3 neurons.

Figure 5—figure supplement 1.

(A) (Left) Schematic of imaging region of interest (ROI); (Right) Staining with trypan blue dye to distinguish L1 from L2-6 for micro-dissection. (B) Changes of spine sGluA1 on basal dendrites in mice with VD or sham-surgery (Sham-surgery: n = 23 dendrites from six mice; VD: n = 40 dendrites from six mice; two-way ANOVA). (C) Changes in spine size on basal dendrites before and after VD (n = 40 dendrites from six mice; one-way ANOVA). (D) Schematic of ascending and descending dendrites from L2/3 neurons. 0 indicates the most superficial dendrite within an imaging ROI or most superficial/proximal spine on a dendritic segment; one indicates the deepest dendrite in an imaging ROI or deepest/most distal spine along a dendrite. (E) Correlation between changes of average sGluA1 level on dendrites and the depth of dendrites from the pia (n = 167 dendrites; Pearson). (F) Correlations between change in spine sGluA1 expression 7 days after VD and spine depth from pia in ascending and descending dendrites (n = 1642 spines from ascending dendrites; n = 1998 spines from descending dendrites; Pearson). (G) Correlations between change in spine sGluA1 signal 7 days after VD and spine distance from dendrite branch point in ascending and descending dendrites (n = 1642 spines from ascending dendrites; n = 1998 spines from descending dendrites; Pearson). (H) Correlation between change in spine sGluA1 expression after 7 days of sham-surgery and spine depth (n = 293 spines; Pearson). (I) Correlations between baseline spine sGluA1 level (imaging day 1) and spine depth (n = 1642 spines from ascending dendrites; n = 1998 spines from descending dendrites; Pearson). (J) Correlations between baseline spine sGluA1 expression (imaging day 1) and spine distance from branch point (n = 1642 spines from ascending dendrites; n = 1998 spines from descending dendrites; Pearson). (K) Changes of spine sGluA1 level in spines located at different depths following 7 days of visual deprivation (n = 188–237 spines; Friedman test). Data are presented as mean ± SEM. n.s., not significant; *p<0.05; **p<0.01; ***p<0.001; ****p<0.0001.