. 2020 Mar 3;9:e52420. doi: 10.7554/eLife.52420

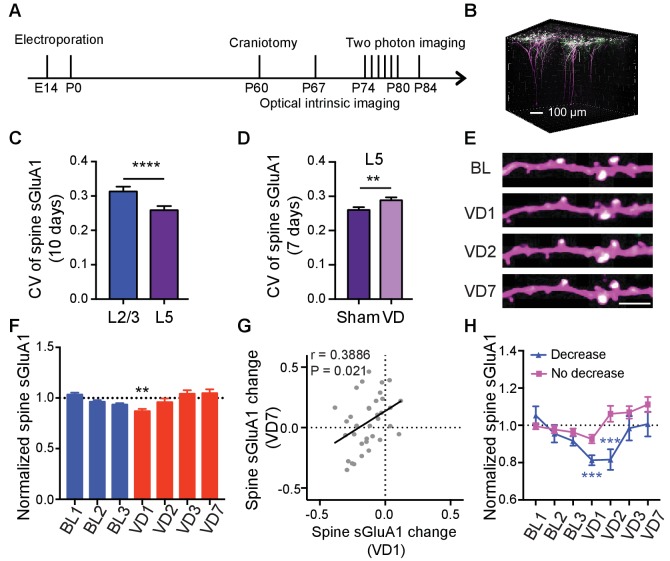
Figure 6. Lamina-specific increases of spine sGluA1 following visual deprivation.

(A) Experimental timeline. (B) 3D reconstruction of L5 neurons of visual cortex transfected with sGluA1 (green) and dsRed2 (magenta), merged in white. (C) Average CV of spine sGluA1 expression in V1 L2/3 and L5 neurons under baseline conditions. (n = 280 spines, L2/3 neurons; n = 256 spines, L5 neurons; Student’s t-test). (D) The CV of spine sGluA1 in L5 neurons before and after visual deprivation. (n = 256/277 (Sham/VD) spines in L5 neurons; Student’s t-test). (E) Representative time-lapse images of L5 apical dendrites. Scale bar: 5 μm. (F) Changes in spine sGluA1 expression on apical dendrites of V1 L5 neurons following VD (n = 35 dendrites from four mice; one-way ANOVA). (G) Correlation between spine sGluA1 changes of individual dendrites in L5 neurons at day 1 and day 7 after VD (n = 35 dendrites; Pearson). (H) Changes of spine sGluA1 expression in cells that show decrease or no decrease at day 1 following VD in L5 neurons. (n = 6 decrease cells and n = 6 no decrease cells from four mice; one-way ANOVA). Data are presented as mean ± SEM. **p<0.01; ***p<0.001; ****p<0.0001.

Figure 6.

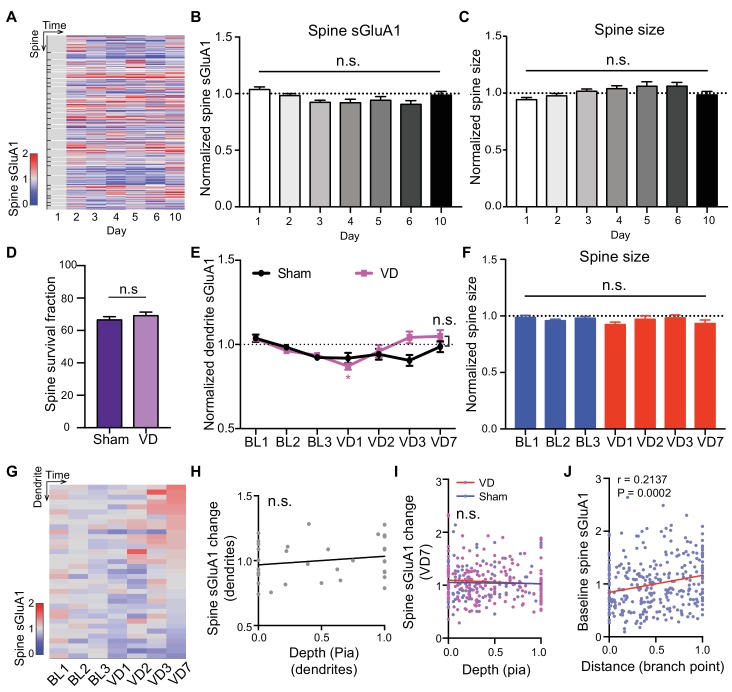
Figure 6—figure supplement 1. Lamina-specific increases of spine sGluA1 following visual deprivation.

Figure 6—figure supplement 1.

(A) Heat map of sGluA1 expression within individual spines of V1 L5 neurons. Spines on the same dendrites were grouped together. (B) Changes in spine sGluA1 expression in V1 L5 neurons under basal states (n = 29 dendrites from four mice; one-way ANOVA). (C) Changes in spine size in V1 L5 neurons under basal states (n = 29 dendrites from four mice; one-way ANOVA). (D) Percentage of spines that persist across 10 imaging days in L5 neurons from mice with or with visual deprivation. (n = 23/49 (Sham/VD) dendrites). (E) Changes in spine sGluA1 level in mice with sham-surgery or visual deprivation (Sham-surgery: n = 29 dendrites from four mice; VD: n = 35 dendrites from four mice; two-way ANOVA). (F) Changes in spine size in V1 L5 neurons before and after visual deprivation (n = 35 dendrites from four mice; one-way ANOVA). (G) Heat map of change in sGluA1 level within individual dendrites in V1 L5 neurons following visual deprivation. (H) Correlation between changes of average sGluA1 level on dendrites and the depth of dendrites from pia in V1 L5 neurons (n = 34 dendrites; Pearson). (I) Correlations between change in spine sGluA1 level 7 days after VD or sham-surgery and spine depth from the pia in ascending dendrites (n = 181 spines from VD group; n = 268 spines from sham group; Pearson). (J) Correlations between baseline spine sGluA1 expression (imaging day 1) and spine distance from dendrite branch point (n = 298 spines; Pearson). Data are presented as mean ± SEM. n.s., not significant; *p<0.05.