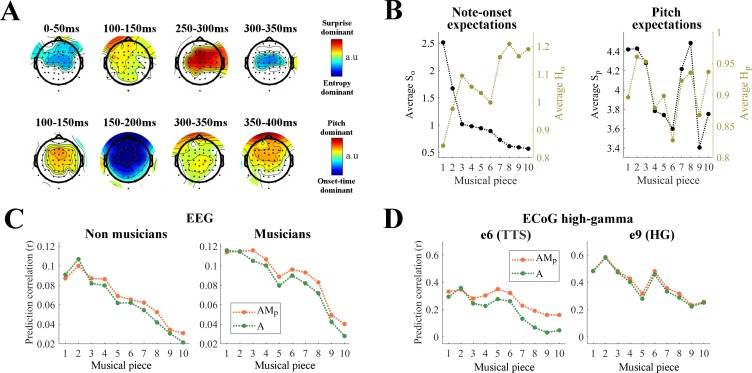
Figure 6. Distinct cortical encoding of pitch and note onset-time during naturalistic music listening.
(A) Contrasts at each EEG channel of the TRF weights for surprise vs. entropy (top) and pitch vs. onset-time (bottom) in TRFAM. Colors indicate significant differences (p<0.05, permutation test, FDR-corrected) (B) Average surprise and entropy of note-onsets (So and Ho) and of pitch (Sp and Hp) for each musical piece. Musical pieces were sorted based on So, where lower average So indicates musical pieces with more predictable tempo. (C) Cortical tracking of music changes with overall surprise of note onset-time within a musical piece. Single-trial EEG prediction result (average across all channels) for musicians (Nm = 10) and non-musicians (Nn = 10). Trials were sorted as in panel B. (D) Single-trial ECoG prediction correlations for the surgery Patient one for two electrodes of interest.


